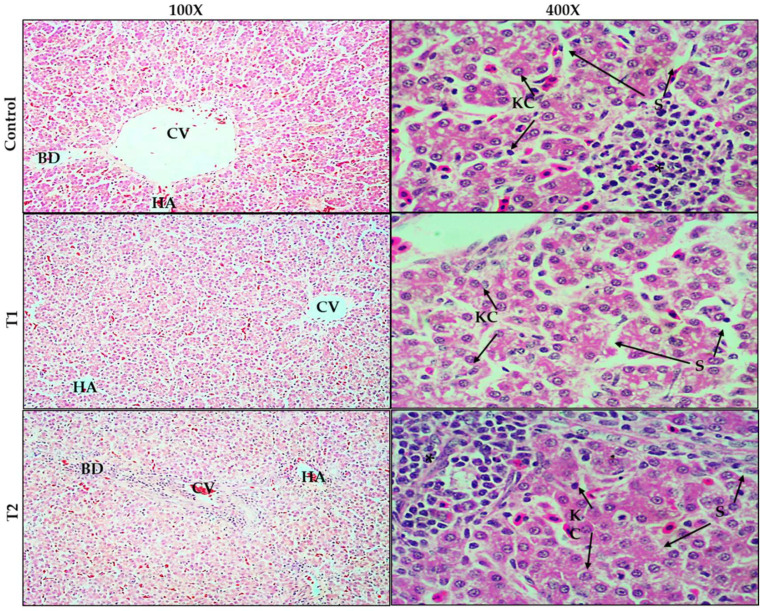
Figure 1.
Histological changes in the liver of broiler chickens stained with (H&E) 100× to 400×. Control, birds fed basal diet; T1, basal diet containing 0.75 g Tribulus Terrestris/kg feed; T2, basal diet containing 1.5 g Tribulus Terrestris/kg feed. CV = central vein; S = sinusoids; KC = Kupffer cells; HA = hepatic artery; BD = bile duct. Chicken liver (control): shows normal morphology of hepatocytes with focal inflammatory infiltration by leukocytes (lymphocytes) (star) and dilatation of the CV. Chicken liver (T1): hepatocytes are more normal but sinusoidal spaces are dilated (S) and CV is narrower than control group. The chicken liver (T2): hepatocytes normal, but swollen hepatocytes in some areas with lymphocyte infiltration around the central vein (star) and loss of lining endothelial cells.

