Figure 4.
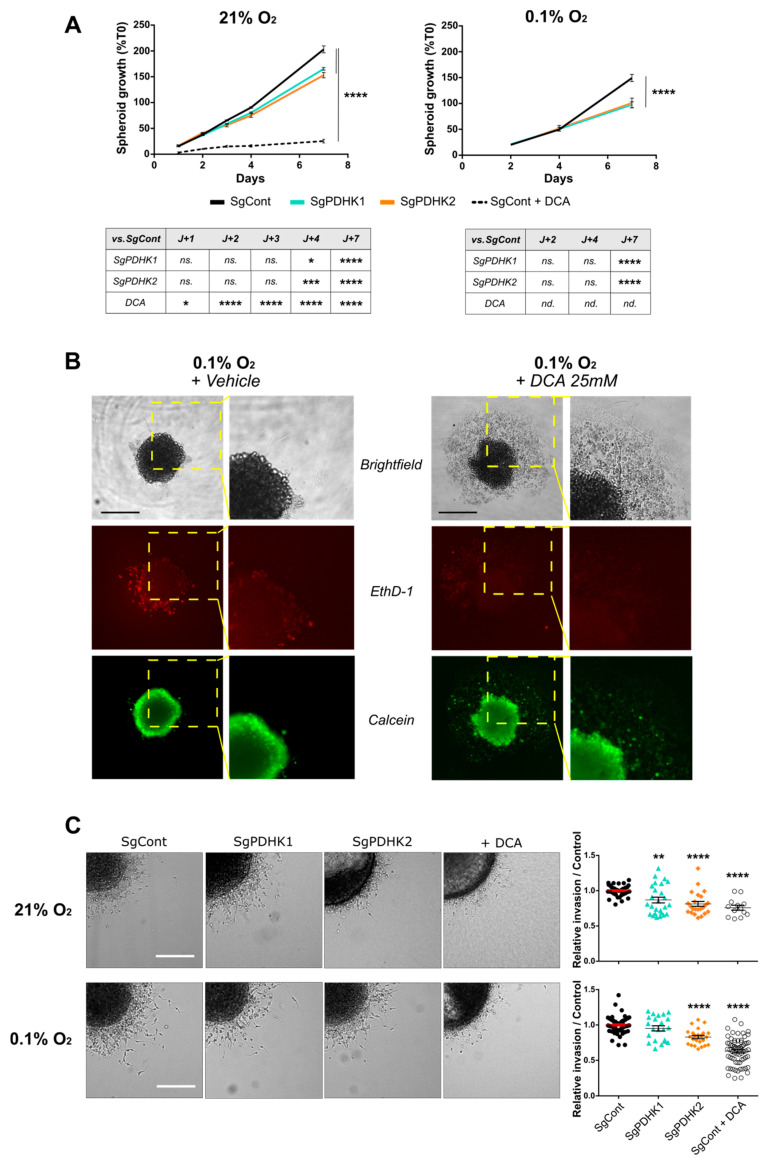
Genetic or pharmacologic PDHK disruption impairs GB cell proliferation and invasion. (A) Left panel: P3 spheroid growth recorded over 7 days in normoxic conditions (21% O2, 8–12 spheroids per condition, n = 3). Statistics versus control condition are presented in the table. Right panel: the same experiment was processed in hypoxic condition (0.1% O2). (B) Evaluation of live/dead cell status of spheroids exposed to both hypoxic conditions and DCA treatment. Upper panel: brightfield image of P3 SgCont spheroid before and after being exposed to vehicle or DCA 25 mM treatment for 7 days (left: vehicle; right: DCA). Middle and lower panels: viability assessment of spheroids, incubated with calcein (green) and ethidium homodimer (red), after a 7-day DCA or vehicle treatment. Scale bar: 150 µm. (C) Left panel: representative images of invasive spheroids SgCont, SgPDHK1, SgPDHK2 or treated with DCA, included in a collagen I matrix and incubated either at 21% or 0.1% O2 for 24 h. Scale bar: 150 µm. Right panel: relative invasion rate compared with the control condition (8–10 spheroids per condition, n = 3 to 5) upon 21% or 0.1% O2 exposure. Data are expressed as the mean ± SEM, and p-values were obtained using two-way ANOVA (A,C); * p < 0.05; ** p < 0.01; *** p < 0.001; **** p < 0.0001; ns.: not significant; nd.: not determined.

