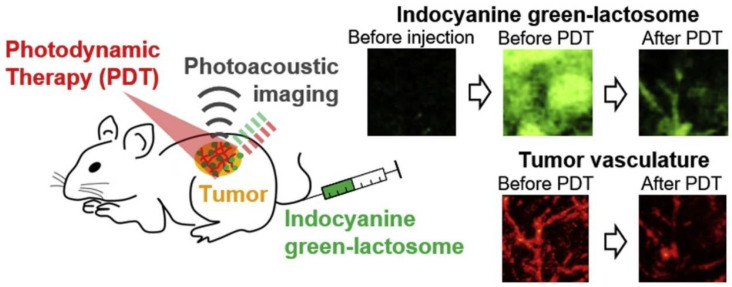
Figure 3.
Schematic of photodynamic therapy (PDT) and photoacoustic imaging with ICG-lactosomes. Photoacoustic images (3.9 × 3.9 mm2) show the accumulation of ICG-lactosomes in the tumor (before PDT). The photoacoustic probe was automatically scanned over a 3.9 mm × 3.9 mm region of interest with a step size of 50 and 150 μm for imaging of blood vessels and ICG distribution, respectively. The wavelength of the short laser pulse was 532 nm for photoacoustic imaging of oxy- and deoxy-hemoglobin in blood vessels. The laser pulse at 796 nm was used for ICG imaging. Results of the fluorescence imaging of ICG showed that the photoacoustic imaging decreased by only 0.78% in average fluorescence intensity originating from ICG in the tumor (data not shown), indicating a negligible photobleaching by the laser light for photoacoustic imaging. After PDT, the photoacoustic signal was drastically decreased, suggesting photobleaching in the tumor. (Reprinted from Tsunoi et al. [13] with permission from Elsevier).

