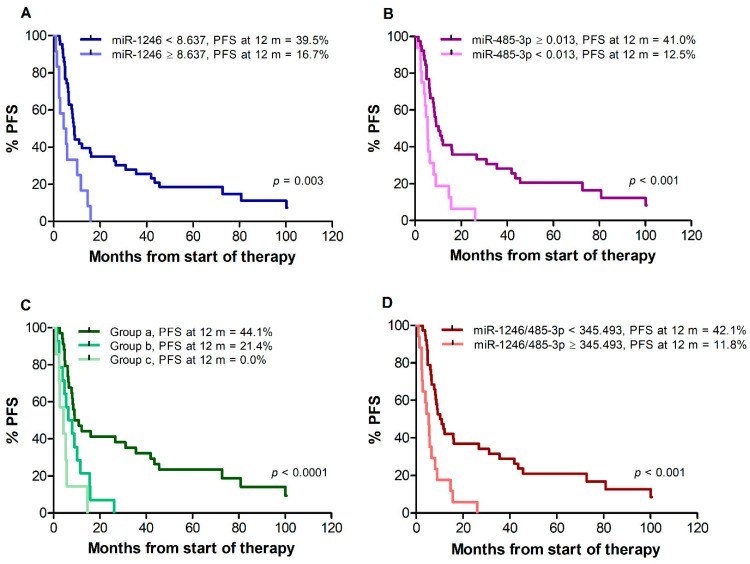
Figure 2.
Kaplan–Meier curves for progression-free survival (PFS) of melanoma patients treated with targeted therapy. Patients were stratified by T0 levels of miR-1246 (A), miR-485-3p (B), both miR-1246 and miR-485-3p (C), miR-1246/miR485-3p ratio (D). Group (a): miR-1246 < 8.637 and miR-485-3p ≥ 0.013; group (b): miR-1246 ≥ 8.637 and miR-485-3p ≥ 0.013, or miR-1246 < 8.637 and miR-485-3p < 0.013; group (c): miR-1246 ≥ 8.637 and miR-485-3p < 0.013. p-values are from log-rank test (A,B,D) and log-rank test for trend (C). The estimated percentages of PFS at 12 months from the start of therapy is also reported for each comparison.

