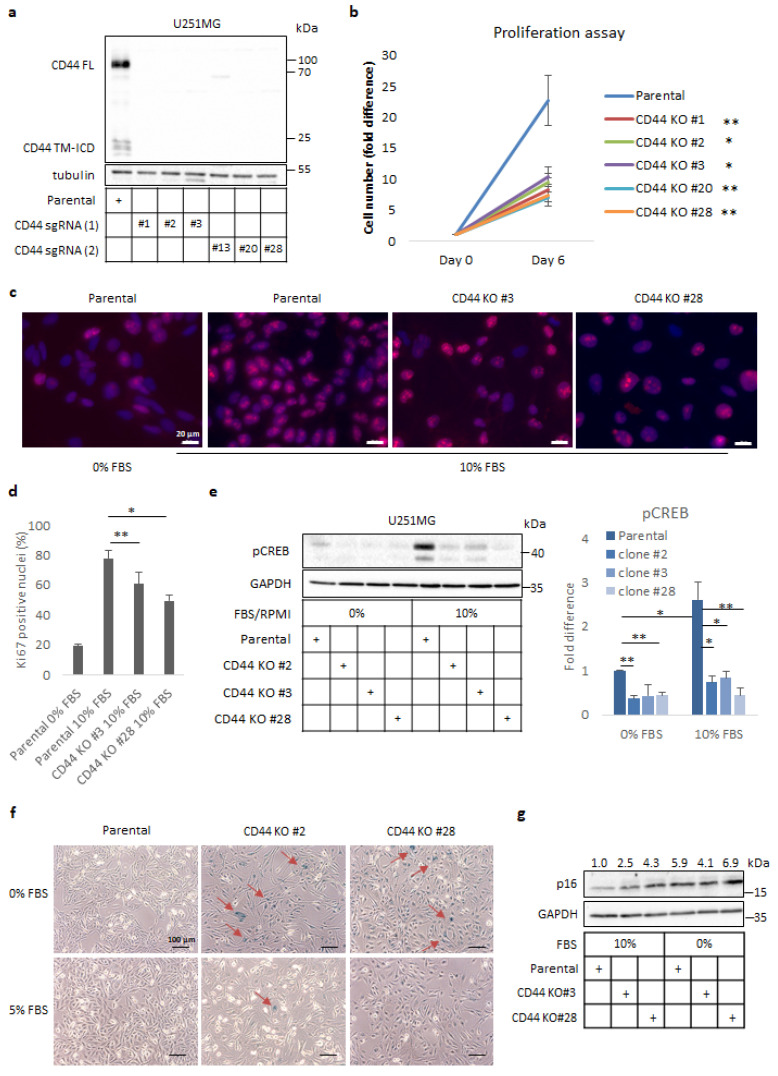
Figure 1.
CD44 depletion reduces proliferation of U251MG cells and induces cellular senescence. (a) Immunoblot analysis of full length (FL) and cleavage products (TM-ICD) of CD44 in either parental or selected clones of CD44 KO clones of U251MG cells after utilizing two different single-guide RNA (sgRNA) constructs (1 and 2). Tubulin was used as the loading control. Uncropped immunoblots are shown in Figure S6. (b) Proliferation assay was performed by counting cells of parental U251MG and selected CD44 KO clones after 6 days in culture. (c,d) Immunofluorescence analysis of Ki67 expression in parental or CD44 KO U251MG cells cultured in 10% FBS containing medium for 24 h; culturing of parental U251MG cells in serum-free medium was used as the negative control (c). Quantification of Ki67-positive nuclei was carried out by using ImageJ software (d). Zeiss Axiovision was used to take the micrographs; bars, 20 μm. (e) Immunoblotting for phospho-(p)CREB after stimulation for 24 h in parental U251MG cells and CD44 KO clones cultured in media containing 10% or 0% FBS. GAPDH served as the loading control; the results are shown as the fold difference after normalization to GAPDH when cells were cultured in 10% FBS-containing medium. Uncropped immunoblots are shown in Figure S7. (f) A senescence-associated-β-gal assay was carried out in parental U251MG and selected CD44 KO clones after the cells had been cultured for 24 h in medium with 0 or 5% FBS. Zeiss Axiovision was utilized to take the micrographs. Bars represent 100 µm. (g) Immunoblotting analysis for p16 was performed following stimulation of cells for 24 h in medium containing 0% or 10% FBS; GAPDH was used as the loading control. Uncropped immunoblots are shown in Figure S8. Quantification of p16 after normalization to GAPDH is depicted above the immunoblots. All graph bars are illustrated as the average ± SEM based on at least three independent experiments. Asterisks depict significant differences compared to the control: * p < 0.05, ** p < 0.01.

