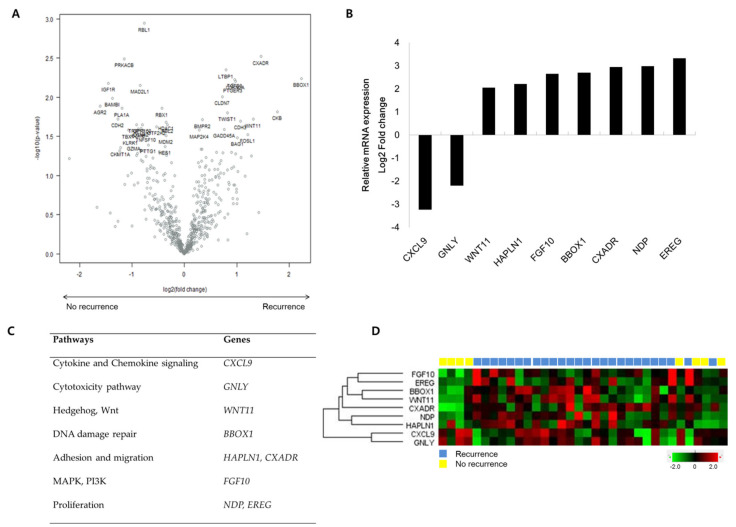
Figure 1.
nCounter Breast Cancer 360 Panel analysis (n = 34). (A) Volcano plot showing differentially expressed genes comparing nonrecurrence and recurrence groups. (B) Relative mRNA expression of nine genes with an absolute value of log2-fold change ≥ 2.0 and p-value ≤ 0.05. (C) Nine genes significantly differentially expressed in nonrecurrence and recurrence groups to categorize the biological processes. (D) Heatmap of NanoString gene expression analysis by nine genes associated with recurrence. The heatmap indicates upregulation (red), downregulation (green), and mean gene expression (black).

