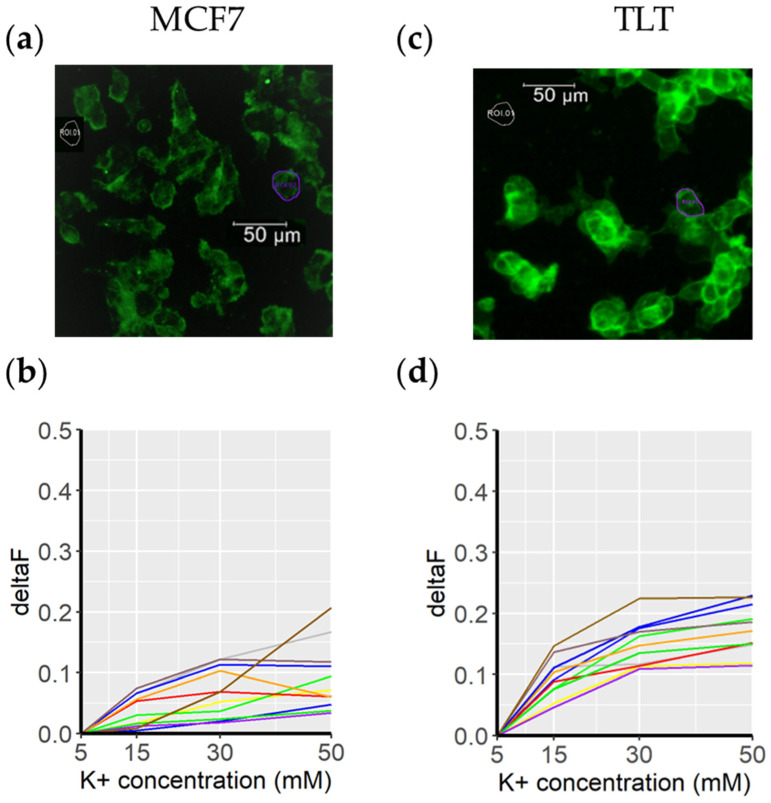
Figure 5.
Fluovolt dye intensity in response to a depolarizing medium. (a) A representative image of MCF7 cells acquired with the FITC/GFP channel. The purple circle (ROI2) marks the cell in which the membrane potential was measured (for clarity, the other cells are not circled). The background signal is shown in gray and is labeled ROI1. The membrane potentials of the cells in this image are shown below, in (b) (each colored line represents a cell from the top image). Cells were cultured with cell culture medium in which the K+ concentration was gradually increased (from 5 mM to 50 mM. The same procedure was applied to the TLT cell line (subfigures (c) and (d)).

