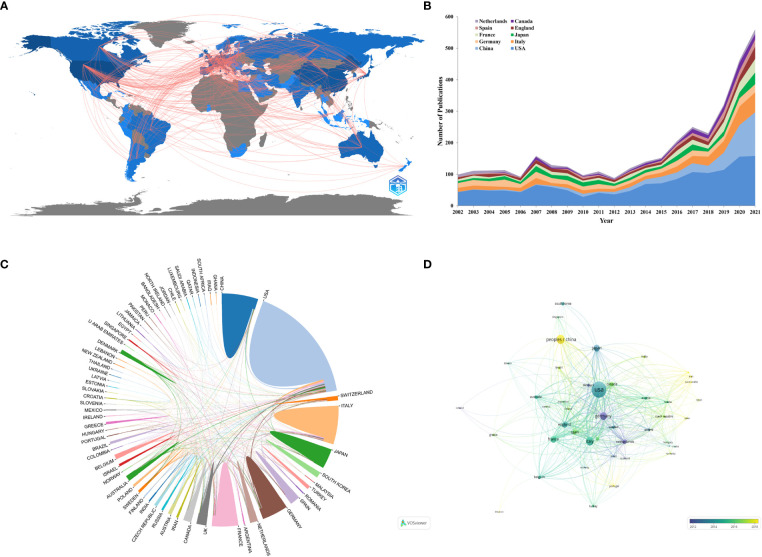
Figure 3.
(A) Geographic distribution map based on the total publications of different countries/regions. (B) The changing trend of the annual publication quantity in the top 10 countries/regions from 2002 to 2021. (C) The international collaborations visualization map of countries/regions. (D) The countries/regions citation overlay visualization map generated by using VOSviewer. Each node means a country/region, and the size of node indicates the number of publications. The connection between the nodes represents the citation relationship, and the thickness of the connection lines indicates citation strength.

