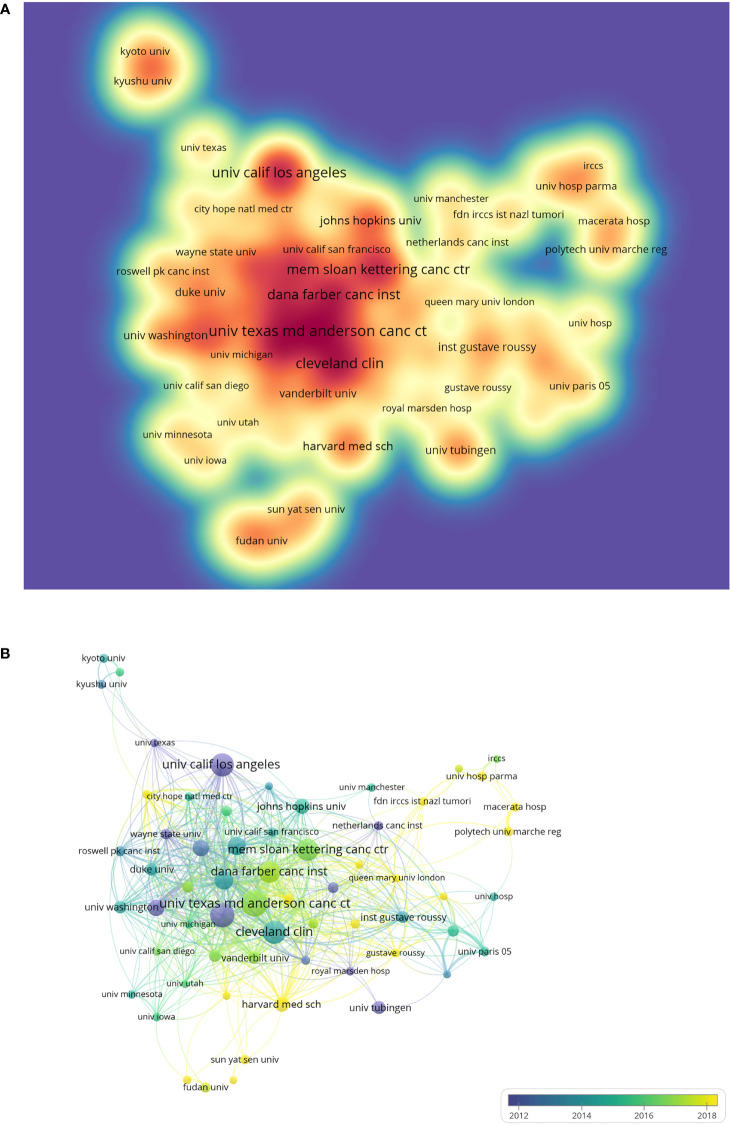
Figure 4.
(A) The spectral density map of organizations was performed with VOSviewer. The deeper the color of the node, the more documents the organization published. (B) The overlay visualization map of organizations’ collaborations based on VOSviewer. The purple nodes represented the early institutions that participated in the research in this field, while the yellow nodes reflected the later organizations.

