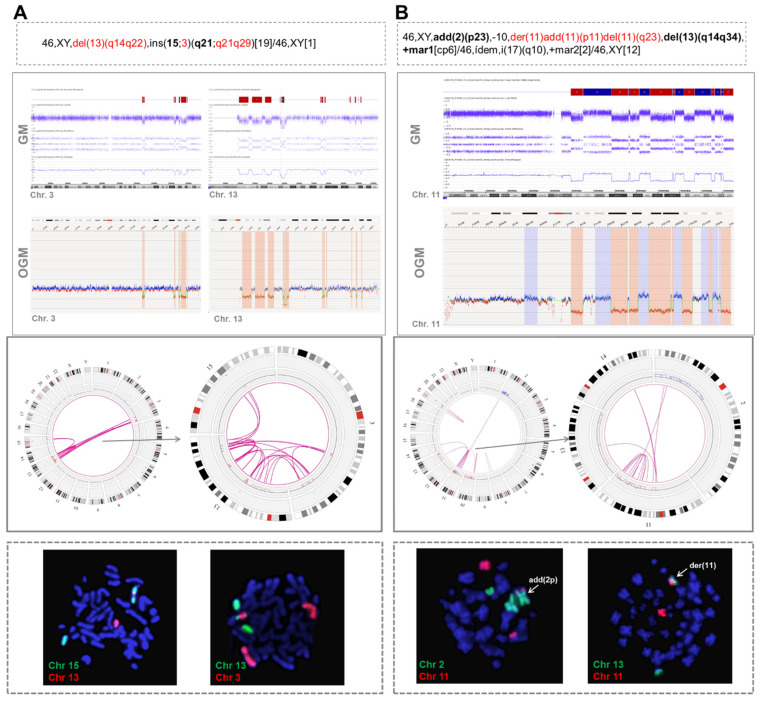
Figure 2.
Two examples of cases with chromothripsis analyzed by optical genome mapping showing rearrangements between chromothriptic and non-chromothriptic chromosomes. (A) Patient with chromothripsis in chromosomes 3 and 13 (case #31). OGM detected 10 rearrangements between chromosomes 3 and 13 and four rearrangements between chromosomes 13 and 15. Whole chromosome FISH painting (WCP) revealed the presence of material from both chromosomes 3 and 13 inserted in chromosome 15. (B) Patient with chromothripsis in chromosome 11 (case #17). OGM revealed the presence of intra-chromosomal translocations and several additional rearrangements involving chromosomes 2, 13 and 14. Notably, t(2;11) and t(11;13) were validated by WCP. Conversely, despite showing only one line in the Circos plot, three parallel t(11;14) were identified by OGM and could not be validated by WCP. However, they could not be ruled out with certainty as true translocations since the rearranged fragment located between the breakpoints was very small and could be missed due to the low resolution of the technique. The abnormalities found by CBA in chromosomes with chromothripsis are highlighted in red in the karyotype. Additional chromosomes associated with chromothriptic events are highlighted in bold. Chromosome views show the comparison of the CNA profiles identified by GM and OGM in the chromothriptic chromosomes. The Circos plot represents the abnormalities identified by OGM for the whole genome (on the left) and for chromothriptic and non-chromothriptic chromosomes involved in this process (on the right). Different layers show, from outer to inner, cytobands of different chromosomes, structural variants (including deletions, duplications, inversions and insertions), copy number alterations and rearrangements, which are represented by lines joining the chromosomes involved.

