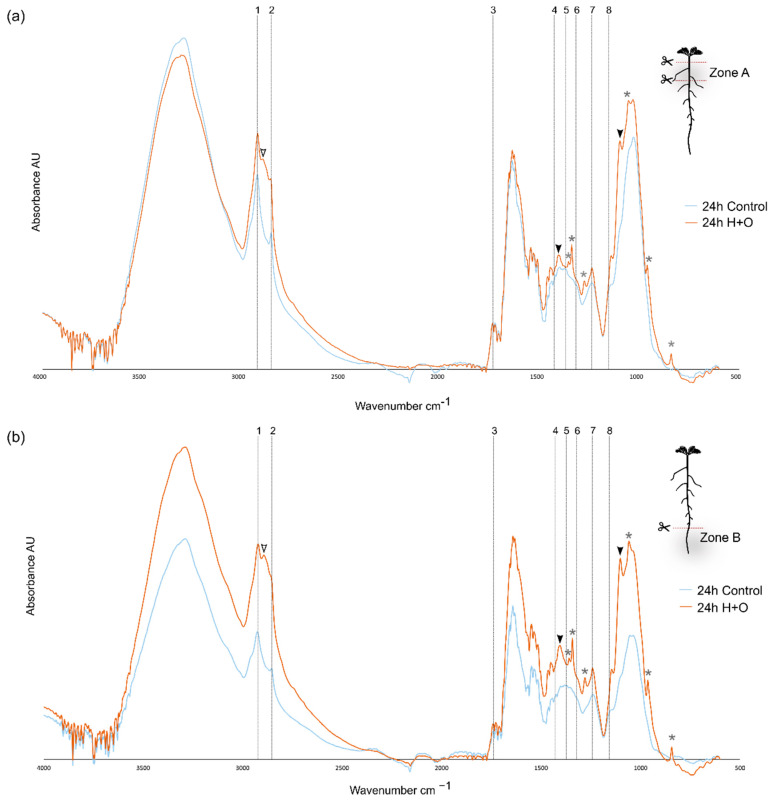
Figure 5.
ATR-FTIR spectra determined for Arabidopsis root zones A (a) and B (b) at 24 h after application of combined heat and osmotic stress (H+O) and control. Vertical dashed lines highlight major peaks assigned for suberin groups: 1 and 2—long aliphatic chains of suberin (2921, 2852 cm−1); 3, 7 and 8—carboxyl and ester groups (1737, 1242, and 1158 cm−1); 4—phenolic compounds (1430 cm−1); 5 and 6—wax or suberin-like aliphatic components (1318 and 1372 cm−1). Arrowheads indicate novel peaks detected in response to combined stress. Asterisks indicate strong peaks resulting from some contamination with PEG6000 used in osmotic stress imposition (see Supplementary Figure S5).

