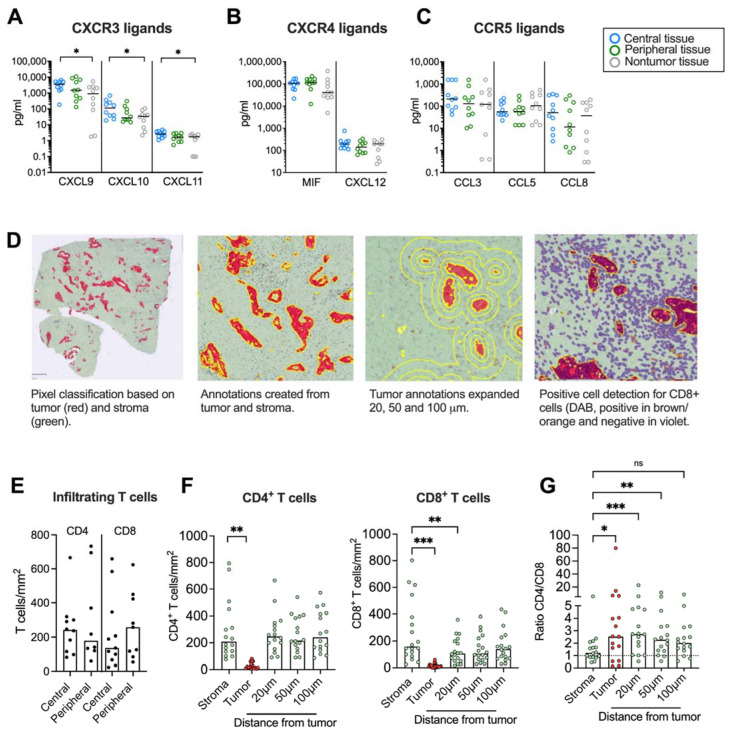
Figure 4.
Immunohistochemical analyses of CD4+ and CD8+ T cells in tumor tissues. (A–C) Chemokine levels in conditioned medium from tumor tissues cultured for 48h. (D, left) Pixel classification based on tumor (CK19 in red) and stroma (green). (Middle left) Annotations to determine tumor and stroma. (Middle right) Annotations to show expanded tumor areas of 20, 50 and 100 μm. (Right) Detection of CD8+ T cells in brown/orange. (E) Infiltrating CD4 and CD8 T cells in central and peripheral tumor tissues (F) Number of CD4+ and CD8+ T cells per mm2 in total stroma, tumor nests (red), and 20, 50 and 100 μm from the tumor nest. (G) Ratio of CD4+/CD8+ T cells in total stroma, tumor nests (red), and 20, 50 and 100 μm from the tumor nest. (A–C,E) Wilcoxon signed-rank test was used to detect statistically significant differences between paired samples. (F) Friedman’s test was used to detect statistically significant differences. ns, not significant. * p < 0.05, ** p < 0.01, *** p < 0.001.

