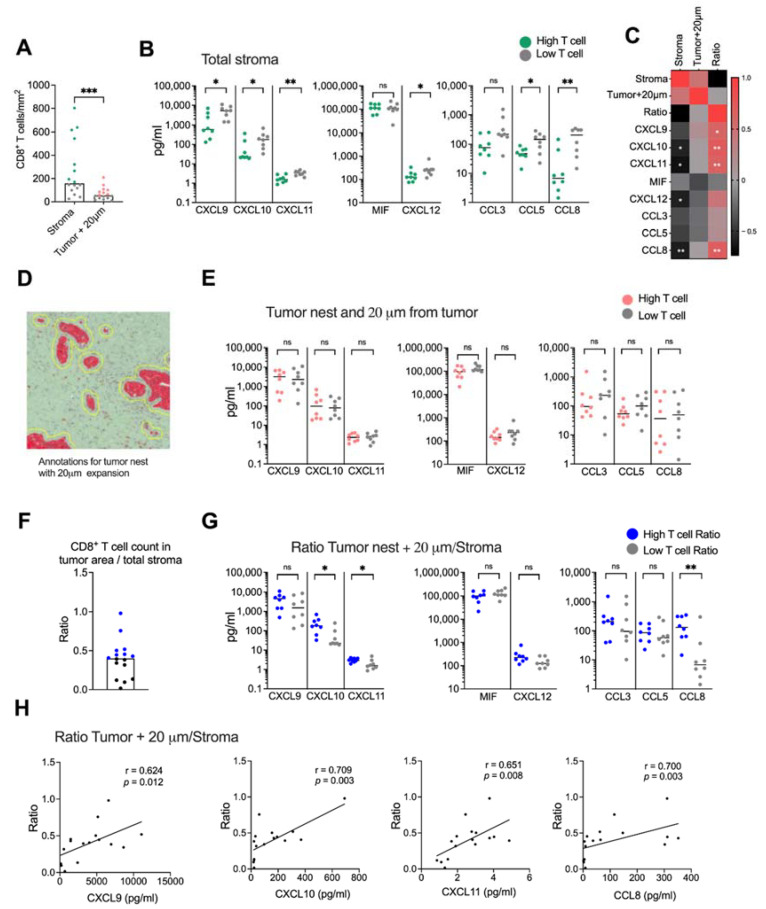
Figure 5.
Spatial localization of CD8+ T cells. (A) Number of CD8+ T cells in stroma and in the tumor nest with 20 μm expansion from the tumor nests. Green and red dots show the donors with CD8+ T cells numbers above the median and gray dots show the donors with CD8+ T cell numbers below the median. (B) Secretion of chemokines in tissues with high CD8+ T cell numbers (green) and low CD8+ T cell numbers (gray). (C) Heatmap correlation matrix showing positive (red) and negative (black) correlations between number of CD8+ T cells and chemokine secretion. (D) Annotations including both the tumor nests and 20 μm from the tumor nests. (E) Secretion of chemokines in tissues with high CD8+ T cells numbers (red) and low CD8+ T cell numbers (gray) in the tumor nests + 20 μm from the tumor nests. (F) Ratio between the number of CD8+ T cells in tumor nest + 20 μm and the CD8+ T cell count in total stroma. (G) Secretion of chemokines in tissues with high CD8+ T cells ratio (blue) and low CD8+ T cell ratio (gray). (H) Correlations between the ratio of CD8+ T cells in tumoral areas (tumor nest + 20 μm from tumor/total stroma) and CXCL9, CXCL10, CXCL11 and CCL8. Mann–Whitney test was used to detect statistically significant differences between unpaired samples. Correlations were evaluated by using Spearman’s correlation test. Spearman r and p-values are presented. ns, not significant. * p < 0.05, ** p < 0.01, *** p < 0.001.

