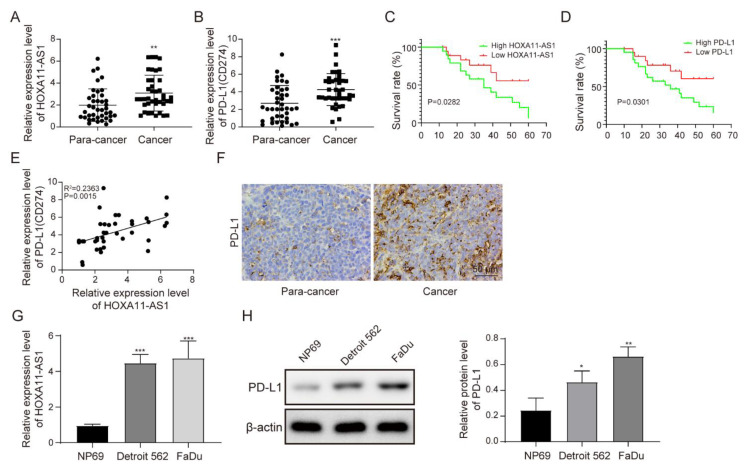
Figure 1.
HOXA11-AS1 and PD-L1 were upregulated in HSCC, and HOXA11-AS1 positively correlated with PD-L1. (A,B) HOXA11-AS1 and PD-L1 expression in 40 HSCC tissues and matched peri-carcinomatous tissues measured by RT-qPCR. (C,D) Kaplan–Meier overall survival curve stratified by HOXA11-AS1 and PD-L1 expression. GraphPad was utilized to calculate the Kaplan–Meier plots, and 40 HSCC patients were included. The high/low expression of HOXA11-AS1 was defined by the median of its expression level, with higher than the median as high expression and lower than the median as low expression. Survival analysis was used. (E) The correlation between HOXA11-AS1 and PD-L1 expression was analyzed by Pearson’s correlation coefficient, n = 40. (F) PD-L1 expression in HSCC tissues was measured by immunohistochemical staining. (G,H) HOXA11-AS1 mRNA expression and PD-L1 protein levels in NP69 and HSCC cells (FaDu and Detroit 562 cells) detected by RT-qPCR and Western blot, respectively; n = 4. * p < 0.05, ** p < 0.01, *** p < 0.001. Original Blots see Supplementary File Figure S1.

