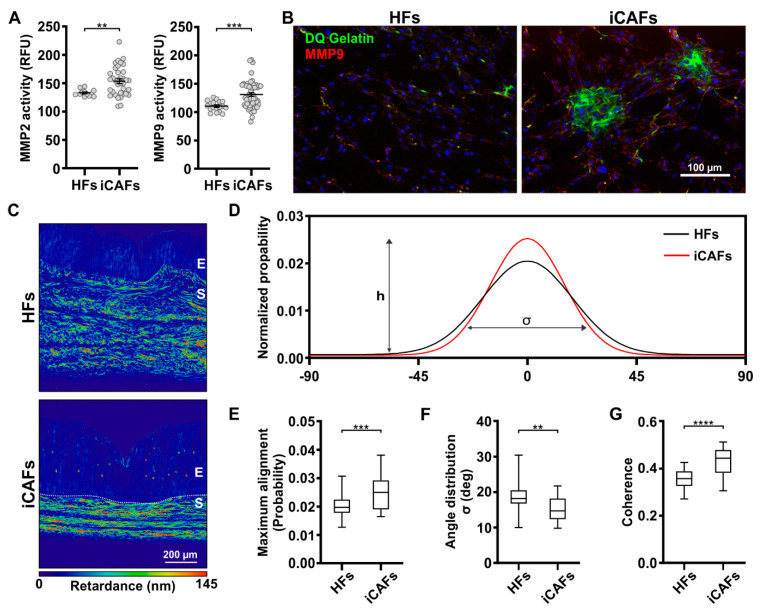
Figure 2.
iCAFs-derived 3D vesical model displays increased remodeling of collagen fibers. (A) Quantification in relative fluorescence units (RFU) of MMP2 and MMP9 activity secreted by HFs and iCAFs. The data are represented as mean ± SEM. N = 4 independent biological replicates. (B) Fluorescence images of the matrix degradation by the HFs and iCAFs visualized with the DQTM gelatin. The green fluorescence corresponds to gelatin degradation and the red fluorescence to MMP9. Nuclei were counterstained with DAPI. (C) Retardance images from HFs-derived and iCAFs-derived constructs stained with Picrosirius red. (D) Measured distribution of the collagen fibers’ spatial orientation over a range of 180°, (E) along with the corresponding quantification of the peak distribution (h) representing the proportion of collagen fibrils at 0°, (F) and the distribution width of the fiber angle (σ). (G) Quantification of the coherence of the Picrosirius red signal as a readout of local ECM alignment in the stroma (N = 3 per condition, 30 images per condition). ** p ≤ 0.01, *** p ≤ 0.001, and **** p ≤ 0.0001.

