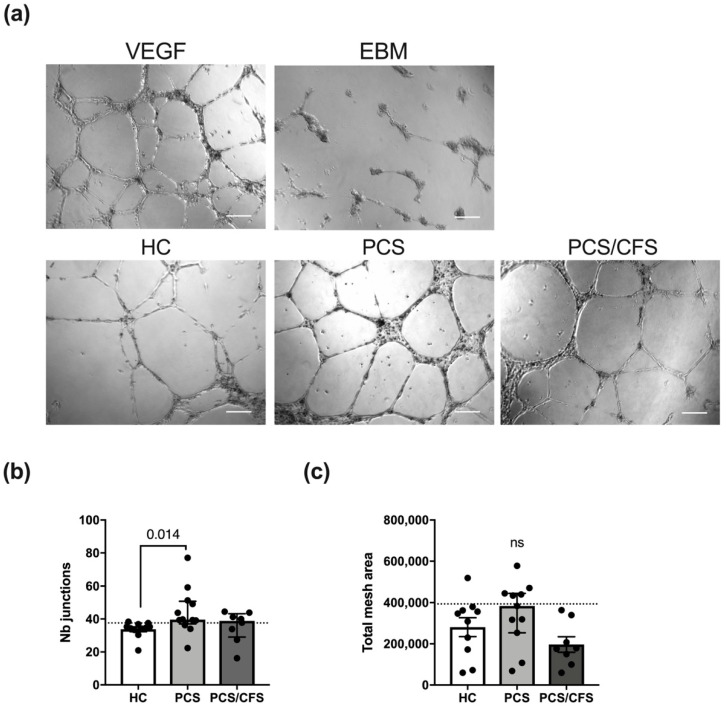
Figure 4.
In vitro angiogenesis assay for serum-treated cultured human endothelial cells. (a) Representative micrographs of HUVEC treated with serum of healthy controls (HC) and both patient groups (PCS, PCS/CFS) as well as the two control settings are shown. Scale bars represent 200 µm. Experiments were performed in duplicate wells and micrographs of five areas from each well were taken. Measurements were taken with the Angiogenesis Analyzer plugin of ImageJ 1.50i. Bar graphs display the network analysis parameters (b) number of junctions and (c) total mesh area, across the patient and control groups. Shown are median, interquartile range and individual values Dotted lines denote the 90th percentile of the HC group. Statistical significance was determined using a Kruska-Wallis test. A p value ≤ 0.05 was considered significant. HC, healthy controls (n = 10). PCS, post-COVID-19 syndrome (n = 11). PCS/CFS, post-COVID-19 syndrome with ME/CFS (n = 8). ns, not significant (p value > 0.05).

