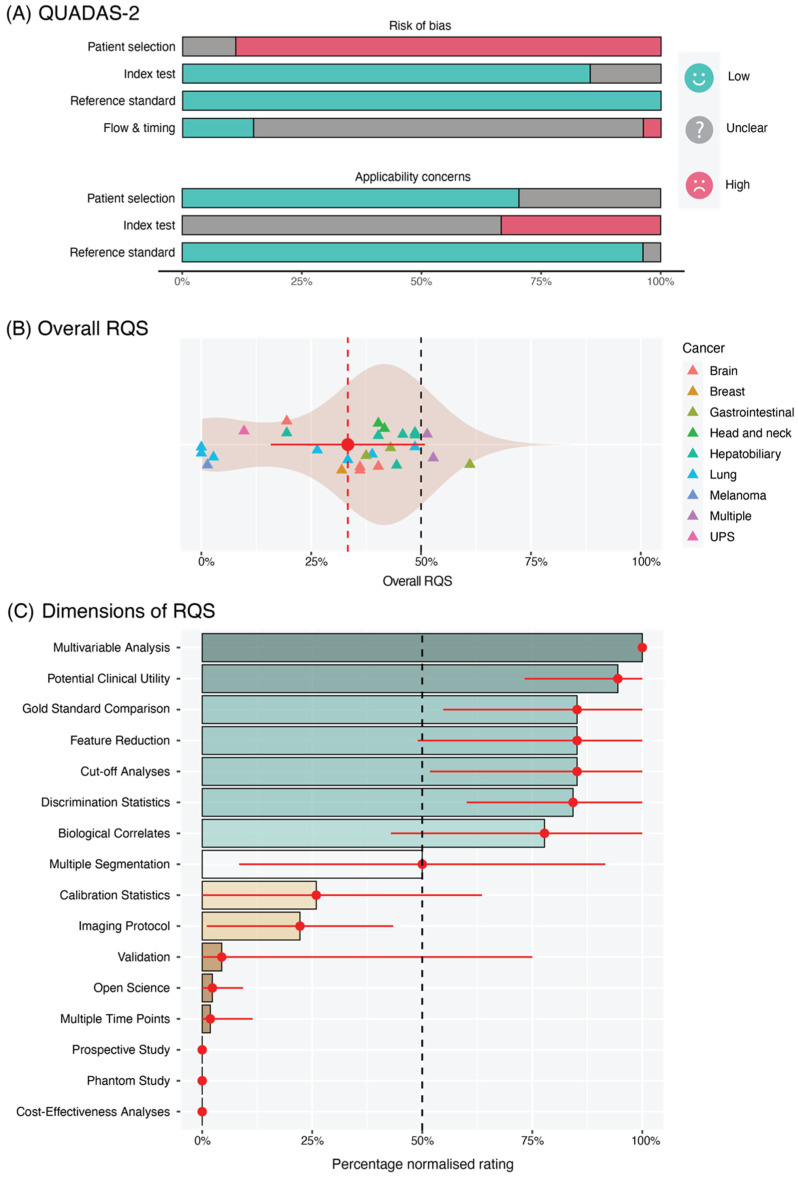
Figure 5.
(A) Summary of QUADAS-2 risk of bias and applicability concern assessments after arbitration between reviewers. (B) Violin plot showing the distribution of the overall RQS scores achieved by reviewed studies. (C) Average ratings for each dimension of the RQS, normalised to percentages (0% = minimum possible positive score; 100% = maximum possible positive score).

