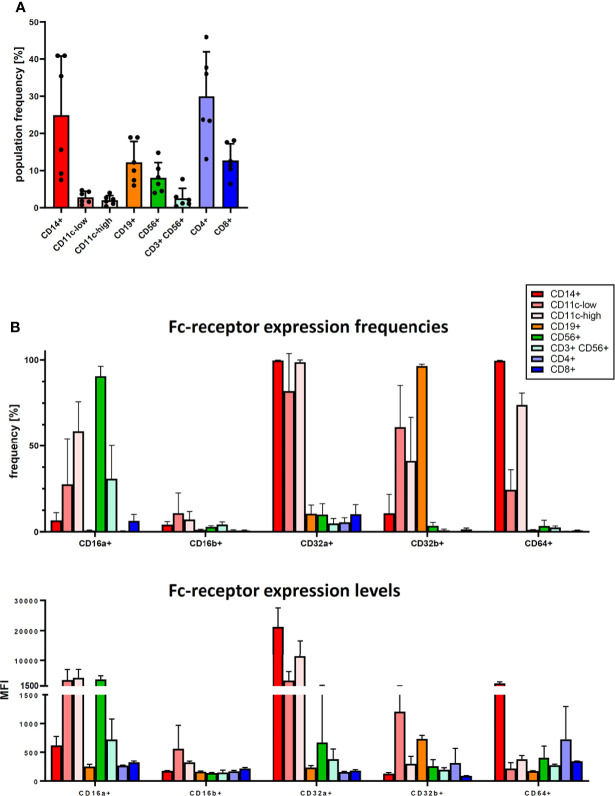
Figure 4.
Fc-receptor profile of PBMC. Cryopreserved PBMC from six healthy donors were analysed for cell population frequency and Fc-receptor expression profile. (A) Frequency of major immune cell populations. Data are shown as bars of mean + SD, and as symbols indicating each separate donor. (B) Fc-receptor expression on the identified immune cell populations. Top panel: frequency of cells expressing a given Fc-receptor within the cell population, lower panel: median fluorescence intensity (MFI) of the Fc-receptor staining of these Fc-receptor-positive cells. Data are shown as bars of mean + SD. * indicates p < 0.05.

