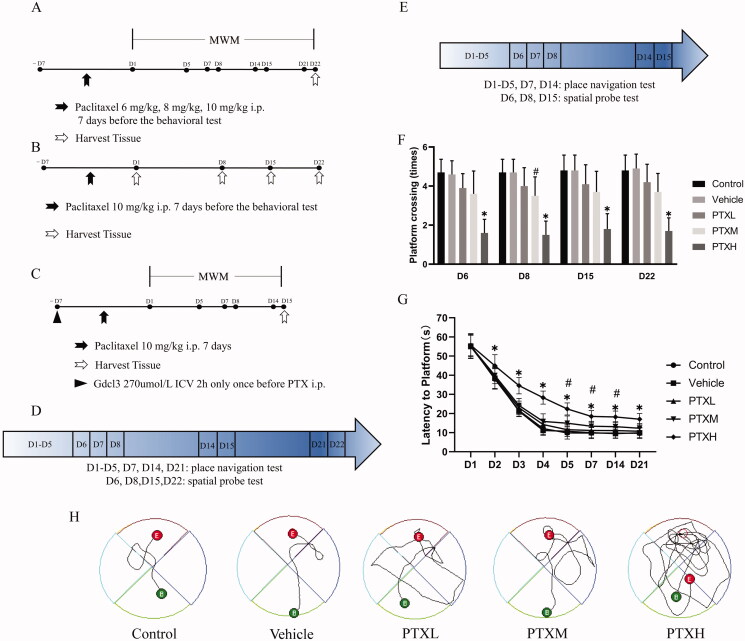
Figure 1.
The behavioural test of PTX-treated mice under the different experimental conditions. (A, B, C) Experimental protocol. (D, E) Morris water maze flowchart. (F) The escape latency(s). (G) The number of times the mice passed over the platform. (H) Movement trajectories of mice on 21st day. The results are presented as the mean ± SD, n = 10. In the PTXM group, #p < 0.05 vs. vehicle. In the PTXH group, *p < 0.05 vs. vehicle.

