
Figure 2.
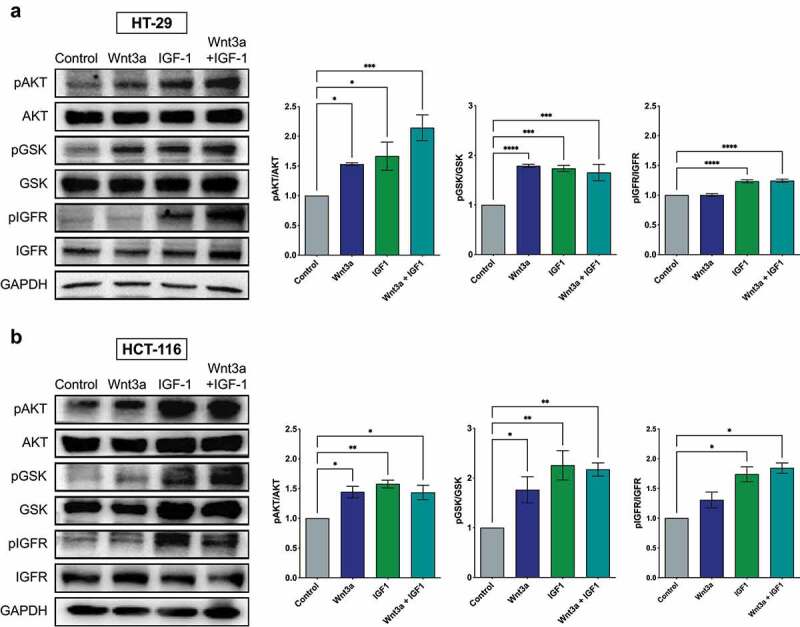
Activation of the PI3K/Akt pathway after treatment with Wnt3a, IGF1, or Wnt3a and IGF1 in CRC cells. Western blotting of pAkt, total Akt, pGSK, total GSK3β, and total IGFR in CRC cell lines HT-29 (a) and HCT-116 (b). The graphs are presented as a densitometric analysis of the ratio between the phosphorylated protein and its total protein expression. Data are presented as the mean ± SEM of three independent experiments. Significance was determined using ANOVA followed by Bonferroni’s post-hoc test (*p < .05, **p < .01 and ***p < .001).