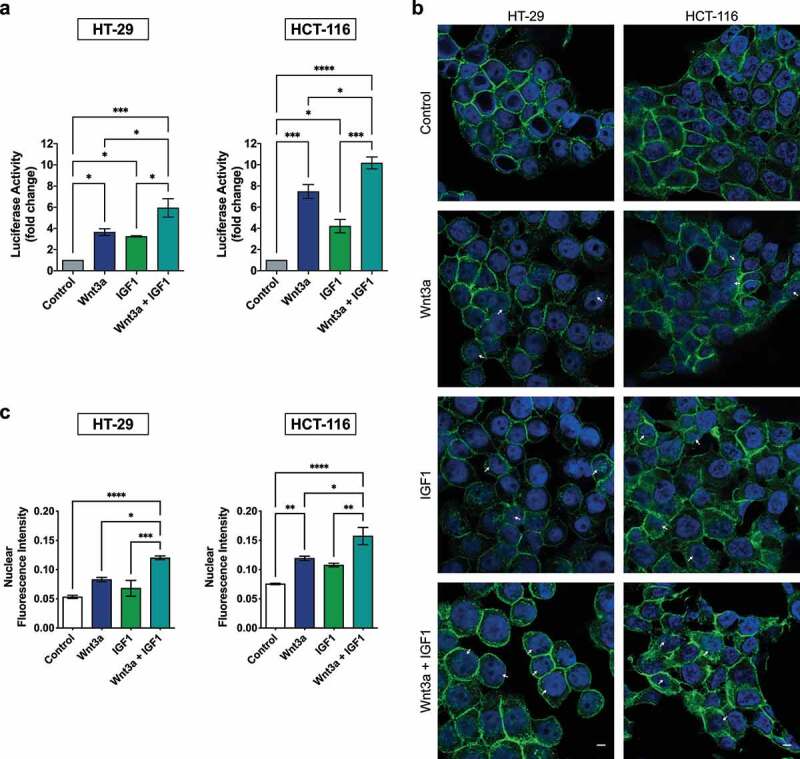
Figure 3.

Treatment with Wnt3a or IGF1 activates the Wnt/β-catenin pathway and the combined treatment of these agents potentiates this effect. (a) Transcriptional activity of β-catenin after respective treatments. Data are presented as the mean ± SEM of three independent experiments. Significance was determined using ANOVA followed by Bonferroni’s post-hoc test (*p < .05, **p < .01 and ***p < .001). (b) Immunofluorescence of β-catenin (green) in CRC cells after the indicated treatments. The nucleus was stained using DAPI (blue). White arrows indicate β-catenin spots in the nuclei. (c) The fluorescence intensity quantification was analyzed using ICY Bioimage Analysis software. Data are presented as the mean ± SEM of three independent experiments. Significance was determined using ANOVA followed by Bonferroni’s post-hoc test (*p < .05). Scalebar equivalent to 20 μm.
