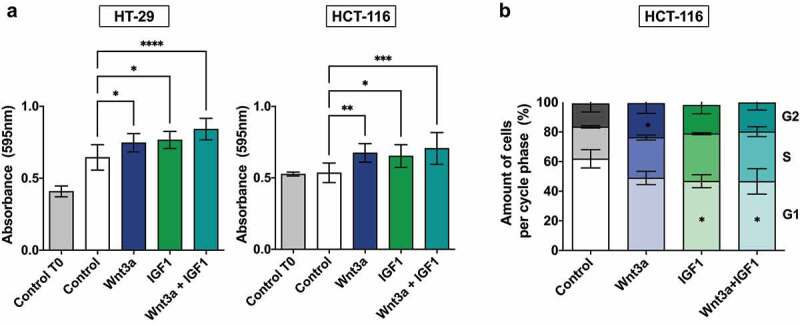
Figure 4.

Cellular proliferation and cell cycle analysis after Wnt3a and IGF treatment. (a) Analysis of cellular proliferation of CRC cell lines by crystal violet assay. T0 represents cells without treatment at the 0 h time point. Data are presented as the mean ± SEM of three independent experiments. Significance was determined using ANOVA followed by Bonferroni’s post-hoc test (*p < .05, **p < .01 and ***p < .001). (b) Quantitative determination of cell cycle phases in HCT-116 cells. Data are presented as the mean of two independent experiments. Significance was determined using ANOVA followed by Bonferroni’s post-hoc test (*p < .05).
