
Figure 5.
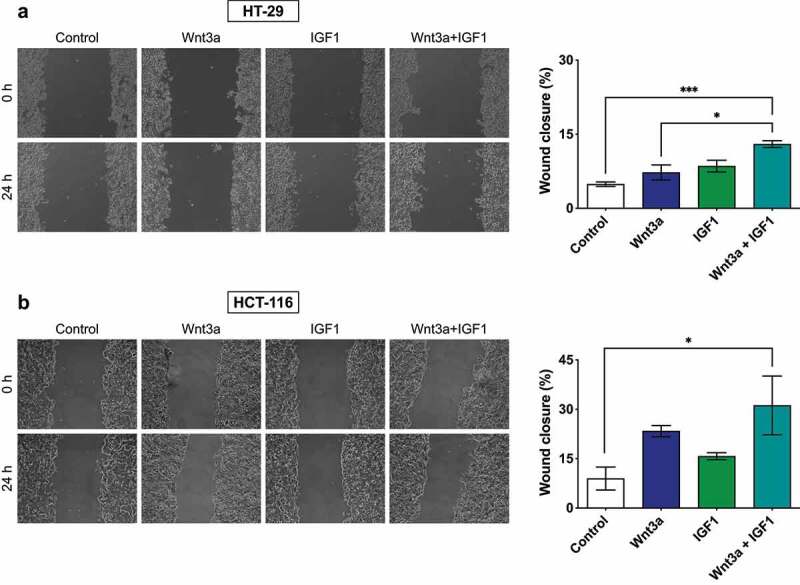
Migratory analysis of HCT-116 and HT-29 CRC cells. Cells were grown until confluence and subjected to a wound-healing assay. Bar graphs represent percentages of cell migration. Data are presented as the mean ± SEM of three independent experiments. Significance was determined using ANOVA followed by Bonferroni’s post-hoc test (*p < .05, **p < .01 and ***p < .001).