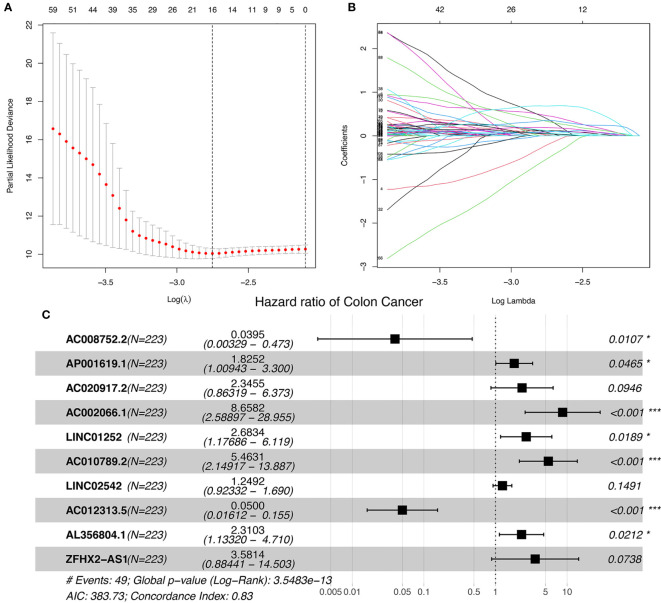
Figure 2.
Ten cuproptosis-related lncRNAs with prognostic significance were selected. (A) The confidence intervals for each lambda were shown. Dotted vertical lines were drawn at the optimal values by using the minimum criteria. (B) Partial likelihood deviance for different numbers of variables. The horizontal axis represents the log value of the independent variable lambda, and the vertical axis represents the coefficient of the independent variable. (C) Multivariate Cox regression analysis showed 10 cuproptosis-related lncRNAs. nsP >= 0.05, *P < 0.05, **P < 0.01, ***P < 0.001.

