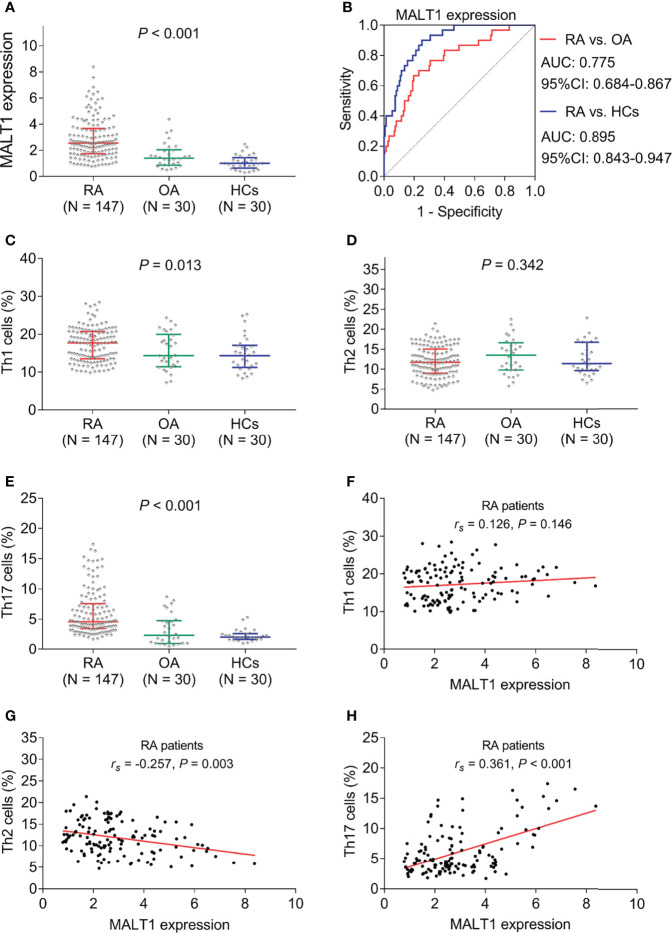
Figure 2.
MALT1, Th1 cells, Th2 cells, and Th17 cells among subjects. MALT1 expression among RA patients, OA patients, and HCs (A). ROC curve analysis of MALT1’s value in differentiating RA patients from OA patients and HCs (B). Th1 cells (C), Th2 cells (D), and Th17 cells (E) among RA patients, OA patients, and HCs. Correlation of MALT1 with Th1 cells (F), Th2 cells (G), and Th17 cells (H) in RA patients.

