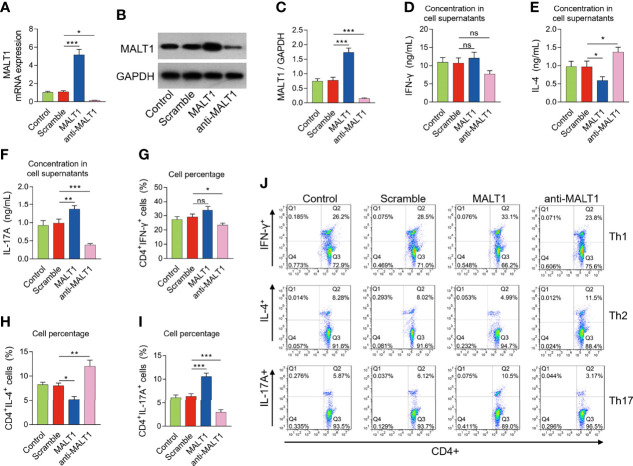
Figure 5.
Effect of MALT1 on Th1/2/17 cell differentiation in RA. MALT1 mRNA expression (A), MALT1 protein expression (B, C) after lentivirus transfection. IFN-γ level (D), IL-4 level (E), IL-17A level (F) in cell supernatants, percentage of CD4+ IFN-γ+ cells (G), CD4+ IL-4+ cells (H), CD4+ IL-17A+ cells (I) after lentivirus transfection. Examples of flow cytometry image after lentivirus transfection (J). * meant P<0.05, ** meant P<0.01, *** meant P<0.001, ns meant not significant.

