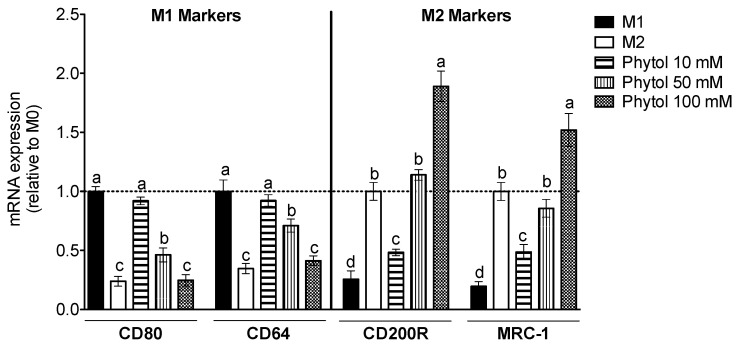
Figure 3.
Effect of Phytol on polarization into M1 or M2 macrophages. M0 macrophage cells were treated with LPS and IFNγ for the M1 control, with IL-4 for M2 control, or with 10–100 mM phytol for an additional 24 h. RT-qPCR was used to measure the relative gene expression of the markers CD80, CD64, CD200R, and MRC-1. The values are means ± SD (n = 3) and, when marked with different letters, they are significantly different (p < 0.01).

