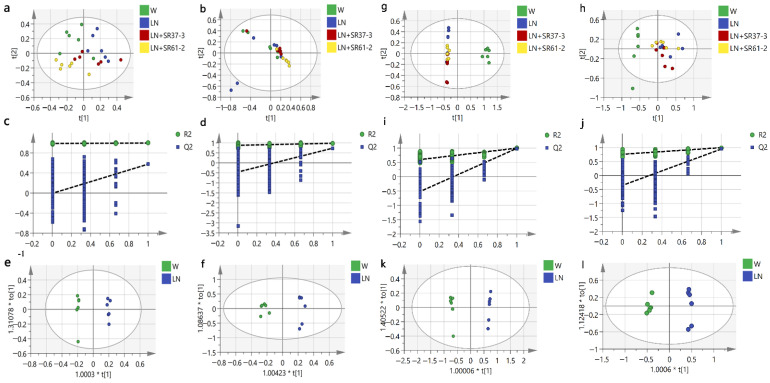
Figure 4.
The analysis of the LC-MS of serum samples of hypertensive rats (a–f). The distribution of the PCA score plots for the W, LN, LN + SR37-3 and SR61-2 groups in the positive model (a) and negative model (b). Permutation test charts for the OPLS-DA model between W and LN of the metabolomics data set in the positive (R2 = (0, 0.989); Q2 = (0, −0.00648)) model (c) and the negative (R2 = (0, 0.876); Q2 = (0, −0.458)) model (d). The OPLS-DA score plot of the metabolomics data set in the positive (R2Y = 0.997; Q2Y = 0.575) model (e) and negative (R2Y = 0.981; Q2Y = 0.732) model (f). The analysis of the LC-MS of cecal contents samples of hypertensive rats (g–l). The PCA score plots distribution for the W, LN, LN + SR37-3 and SR61-2 group in the positive model (g) and negative model (h). Permutation test charts for the OPLS-DA model between the W and LN of the metabolomics data set in the positive (R2 = (0, 0.597); Q2 = (0, −0.52)) model (i) and negative (R2 = (0, 0.759); Q2 = (0, −0.355)) model (j). The OPLS-DA score plot of the metabolomics data set in the positive (R2Y = 0.997; Q2Y = 0.99) model (k) and negative (R2Y = 0.994; Q2Y = 0.945) model (l). cont W: animals not treated with L-NAME receiving standard chow; cont LN: L-NAME-treated rats receiving standard chow; LN + SR37-3: L-NAME-treated rats receiving PFM-SR37-3; and LN + SR61-2: L-NAME treated rats receiving PFM-SR61-2. t[1] is the weight of the regression coefficient for the predicted principal component (abscissa). The data next to “*” represents the weight value. “*” Not practical.

