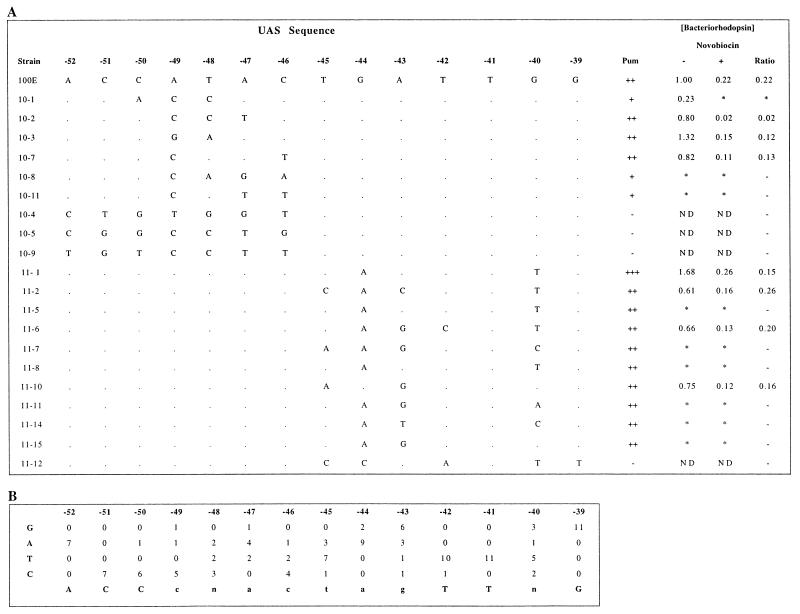
FIG. 4.
Tabulation of strain designations, promoter sequences, phenotypes, and BR contents of UAS mutants (A) and analysis of promoter sequences (B). In panel A, the strain designations are shown in the first column, and sequence of nucleotides −52 to −39 (identity to the wild type base is denoted by a dot), the Pum phenotype (for definitions, see the legend to Fig. 3), and relative BR content are shown to the right. ND, not detectable; ∗, not done. For panel B, the UAS element consensus sequence was determined by tallying individual nucleotides observed at each position in Pum+ strains. The consensus sequence is indicated at the bottom.

