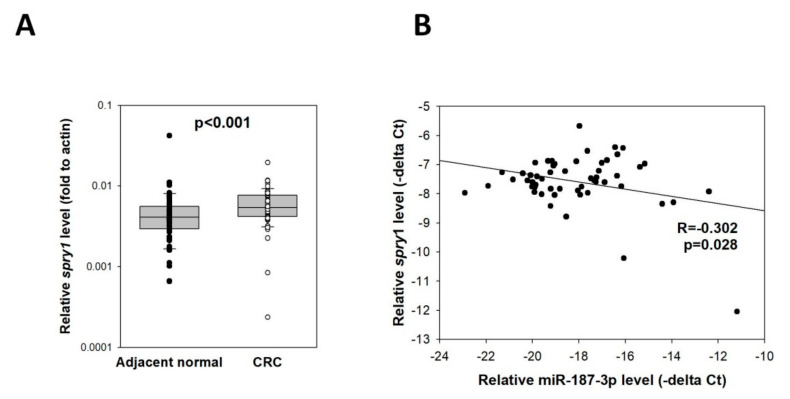
Figure 10.
Expression of SPRY1 and its correlation with miR-187-3p in CRC tissues: (A) Quantitative RT-PCR was performed to determine the SPRY1 levels in 54 paired CRC specimens and adjacent normal mucosa. (B) Pearson’s correlation analysis in the CRC cohort showed that there was a significant inverse correlation between miR-187-3p and SPRY1 (R = −0.302, p = 0.028). The levels of miR-187-3p were expressed as –delta Ct (miR-187-3p–U6), whereas levels of SPRY1 were expressed as –delta Ct (spry1-actin). ∙ and ○ indicated the individual data points of adjacent normal tissues and CRC, respectively.

