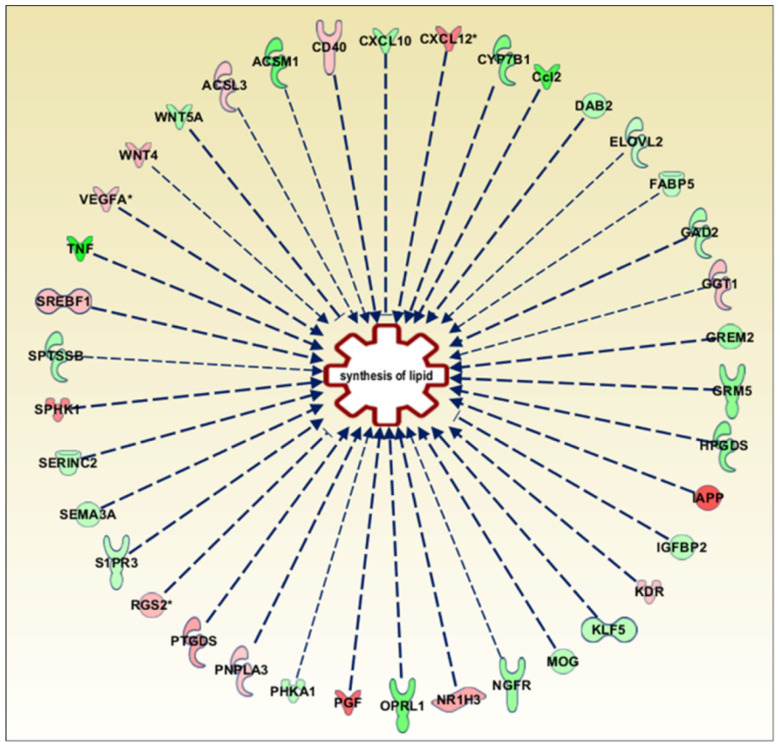
Figure 1.
Ingenuity pathway analysis tool (IPA, Qiagen) was used to analyse dataset and explore the diseases and biological processes which are predicted to be increasing or decreasing based on the pattern of differentially expressed genes in the dataset. From this analysis we extrapolated the scheme in the Figure that includes the genes related to lipid synthesis differentially expressed in our dataset (p-value = 9.67 × 10⁻⁴). The full names of these genes, together with the relative fold change (log2 ratio) are reported in Table S1. In red, upregulated genes; in green, downregulated genes.

