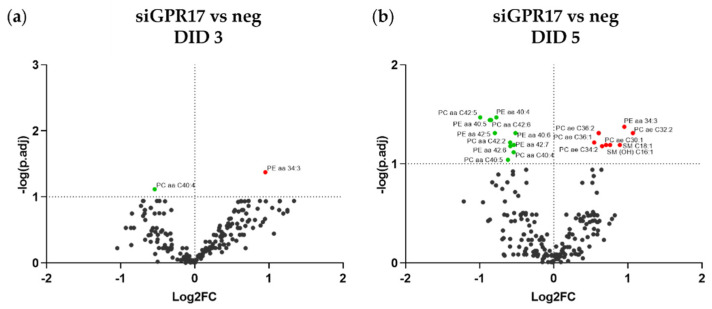
Figure 8.
Lipidomic changes induced by GPR17 silencing in OPCs. (a,b) The abundance of each lipid after GPR17 silencing has been normalized to that in the relative control sample. The resulting fold changes were used to generate a volcano plot for each time point (3, 5 days in differentiation). The points over the dotted horizontal line represent the metabolites that have shown a statistically significant change (Fisher’s LSD corrected by FDR; p.adj < 0.1). In green, lipids with lower expression, in red, those with higher expression, after GPR17 silencing. n = 5 per each group.

