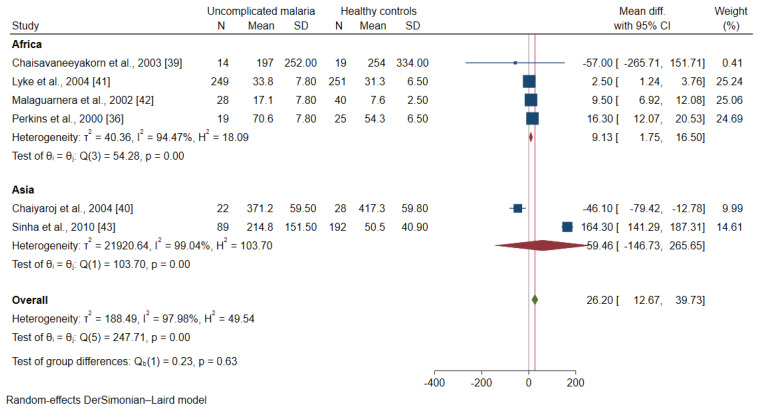
Figure 6.
Forrest plot demonstrated the difference in the mean IL-12 levels (pg/mL) between patients with uncomplicated malaria and healthy controls by continents [36,39,40,41,42,43]. Abbreviation: Mean Diff., mean difference; CI, confidence interval. Explanation of the forest plot: squared-box symbol, point estimate; green diamond and red line: pooled mean difference: red diamond: pooled mean difference in each subgroup; blue line: line of no effect; I2, level of heterogeneity; p = 0.00 or less than 0.05, significant heterogeneity.

