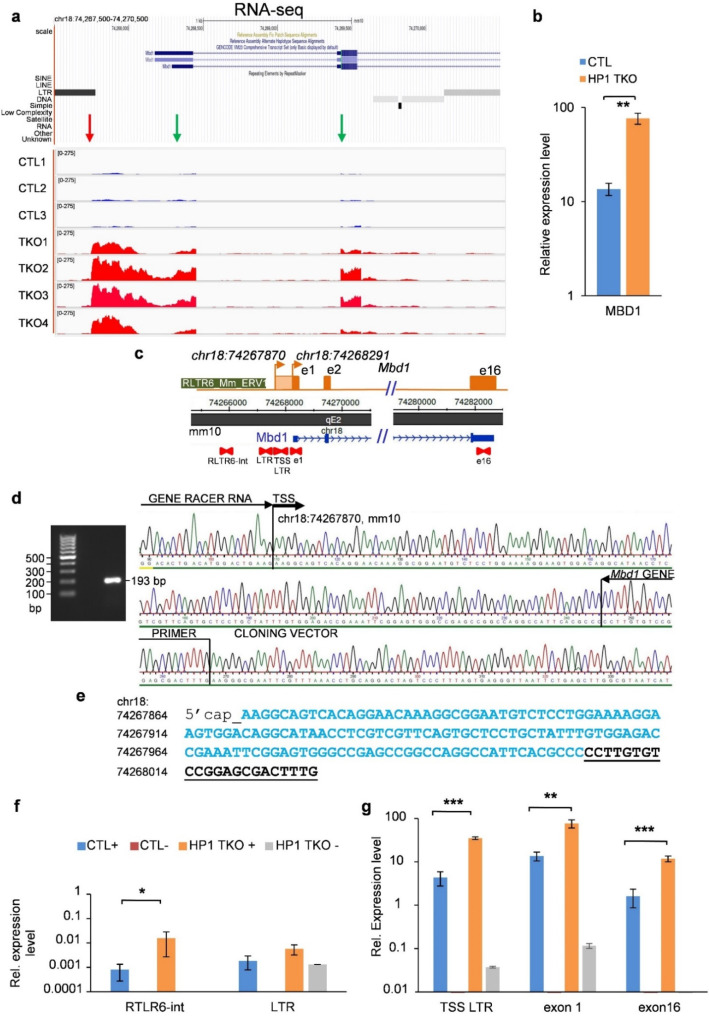
Figure 1.
Endogenous and ERV-derived upstream promoters of Mbd1 are controlled by HP1 proteins. (a) Genome Browser snapshot of RNA-seq data at the Mbd1 locus. Mbd1 mRNA levels were found to be highly increased in HP1-TKO compared to control livers (green arrows), as well as in one intergenic LTR sequence located 517 bp upstream of the Transcriptional Start Site of the endogenous Mbd1 gene promoter (red arrow on the left). (b) RT-qPCRs were performed on total RNA from three HP1-TKO (201, 248 and 316) and three control (202, 251 and 315) mouse liver samples. Primers targeting Mbd1 exon 1 were used and RNA levels were normalised relative to Gapdh mRNA levels. We observe a significant difference in expression level between the two conditions. (c) Map of the mouse Mbd1 locus (chr18:74,089,445–74,522,642, mm10 assembly). Primer pairs used for RT-qPCR are represented by red arrows. (d) A 5′RACE experiment was performed on total capped RNA from TKO mouse liver. Random hexamer primers were used for RT and PCR reactions were performed using the Mbd1_gene primer and the GeneRacerTM 5′ Primer (Supplementary Table S1) located in the GeneRacer RNA indicated in the figure (right panel). The ethidium bromide staining of 1% agarose gel shows the PCR product obtained before cloning and sequencing (left panel). The TSS of the endogenous Mbd1 promoter is located at position chr18:74,268,291 of the mouse mm10 assembly in C57BL-6 liver and the upstream TSS is located at position chr18:74,267,870. (e) The genomic sequence of the transcript issued from the upstream TSS is given in blue and the Mbd1_gene primer sequence used for PCR amplification is underlined in black. (f) Reverse Transcriptions (RT) were performed on total liver RNA from control (CTL) and HP1-TKO mice using primer pairs that target single-copy sequences of the RLTR6-int or RLTR6B elements located upstream of the endogenous Mbd1 promoter (+). Relative expression levels are depicted in bar graphs after normalizing for RNA loading using Gapdh mRNA levels. Control reactions without RT were also performed (-) and they remained below detection limits in control mice (CTL-), while they remained very low in HP1-TKO mice (HP1-TKO-) (grey bars). (g) Relative expression levels of Mbd1 upstream transcript (TSS LTR), and exon 1 or exon 16 containing mRNAs, were measured as described above. Error bars represent s.e.m. of 3 biological replicates. p-value < 0.01 (***), p-value < 0.02 (**), and p-value < 0.05 (*) (Student’s t-test).

