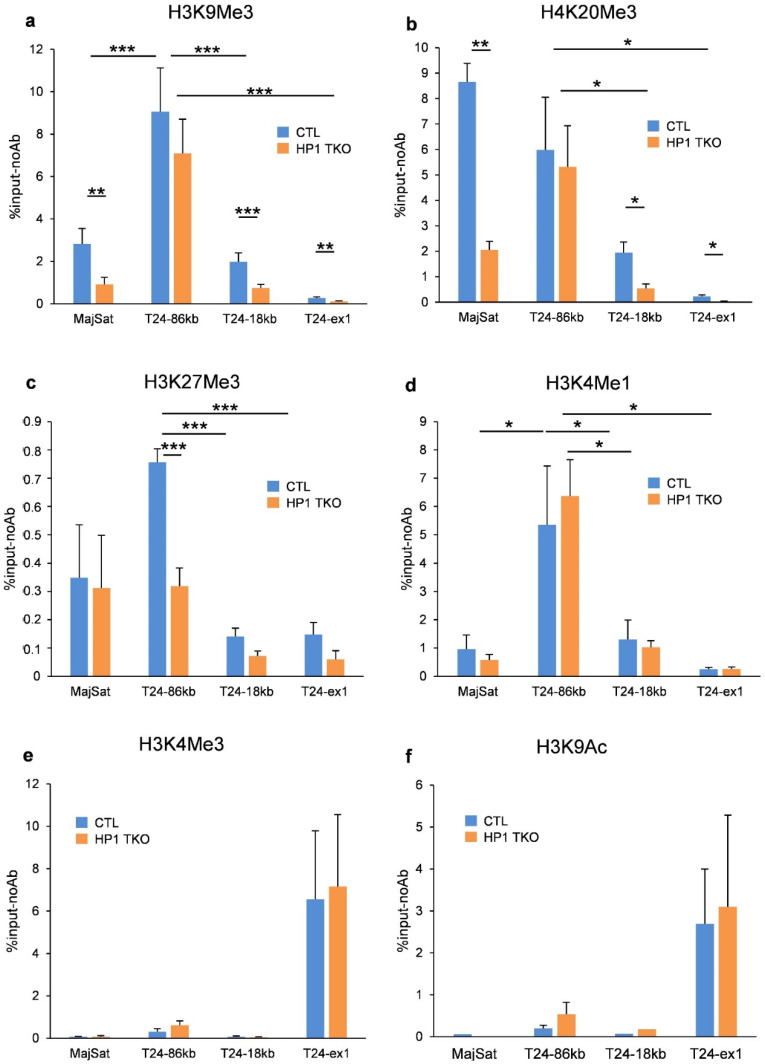
Figure 4.
Epigenetic landscape at the Trim24 gene locus. ChIP-qPCR experiment showing the quantification of different histone modifications in control (blue bars) and HP1-TKO (orange bars) 8-week-old mouse livers at the major satellite repeats (MajSat), at the RLTR6-86 ERV (86 kb), the RLTR6-18 ERV (18 kb) and Trim24 exon1 (Trim24ex1). ChIP-qPCR quantifications are shown as the difference between the percentage of input with antibodies for the different histone modifications and the percentage of input in the absence of antibody (%input-NoAb). (a) H3K9me3, (b) H4K20me3, (c) H3K27me3, (d) H3K4me1, (e) H3K4me3 and (f) H3K9Ac. Error bars indicate s.e.m. of at least three biological replicates. p-values (Student’s t-test) indicate the difference in quantifications between control and HP1-TKO samples or between different genomic sites in control samples: p-value < 0.01 (***), p-value < 0.02 (**), and p-value < 0.05 (*).

