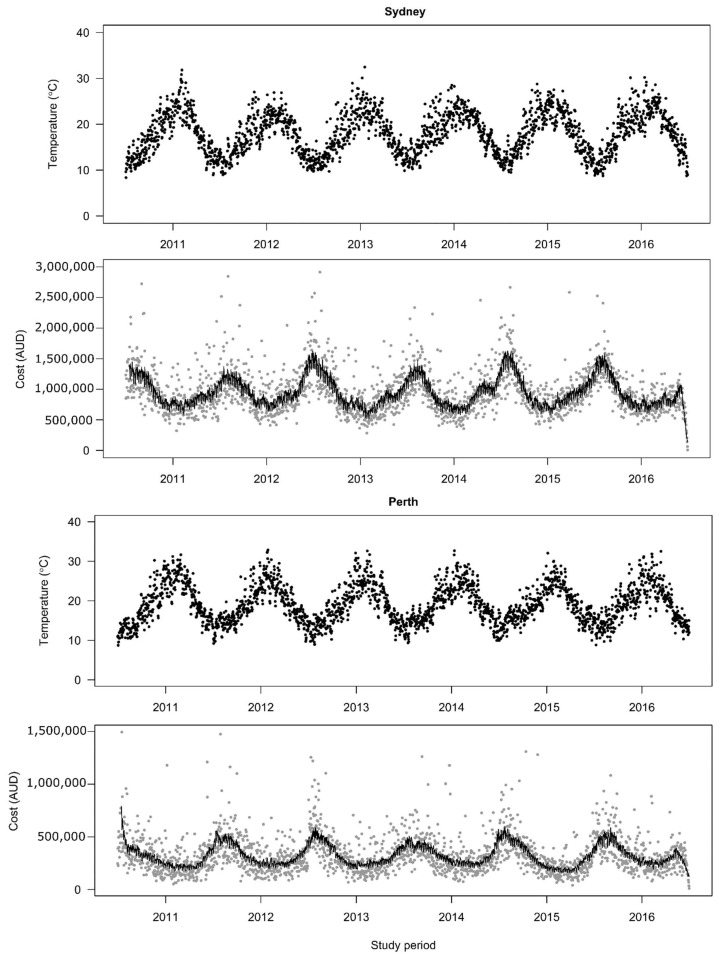
Figure 1.
Time-series plots for daily mean temperatures and daily hospitalization costs of respiratory diseases in Sydney and Perth, 2010–2016. Costs are significantly correlated with the temperatures (Spearman rho = −0.49, p < 0.001) in Sydney and (Spearman rho = −0.43, p < 0.001) in Perth. Dark points are daily mean temperatures; Grey points are daily hospitalization costs; Black line is the best fit line generated based on daily hospitalization costs.

