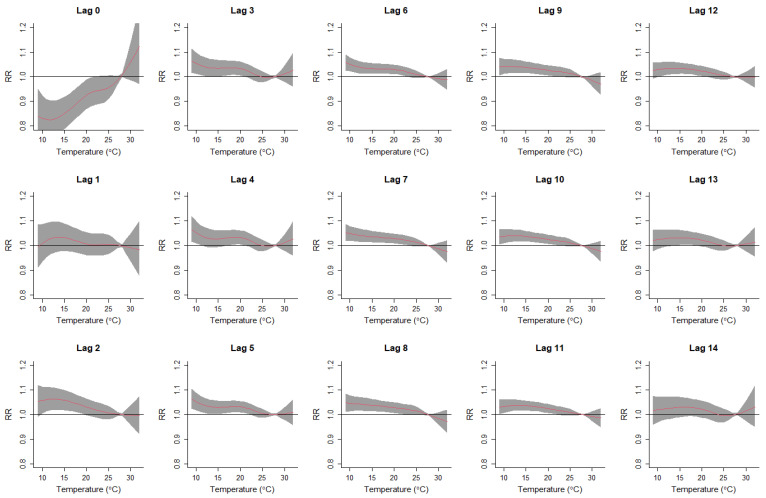
Figure 3.
Lag-specific exposure–response curves for daily mean temperatures and respiratory disease hospitalization costs in Sydney, 2010–2016. RR is relative risk for respiratory disease hospitalization costs. The red lines represent the lag-specific relative risk, and the grey shaded areas represent the 95% confidence interval.

