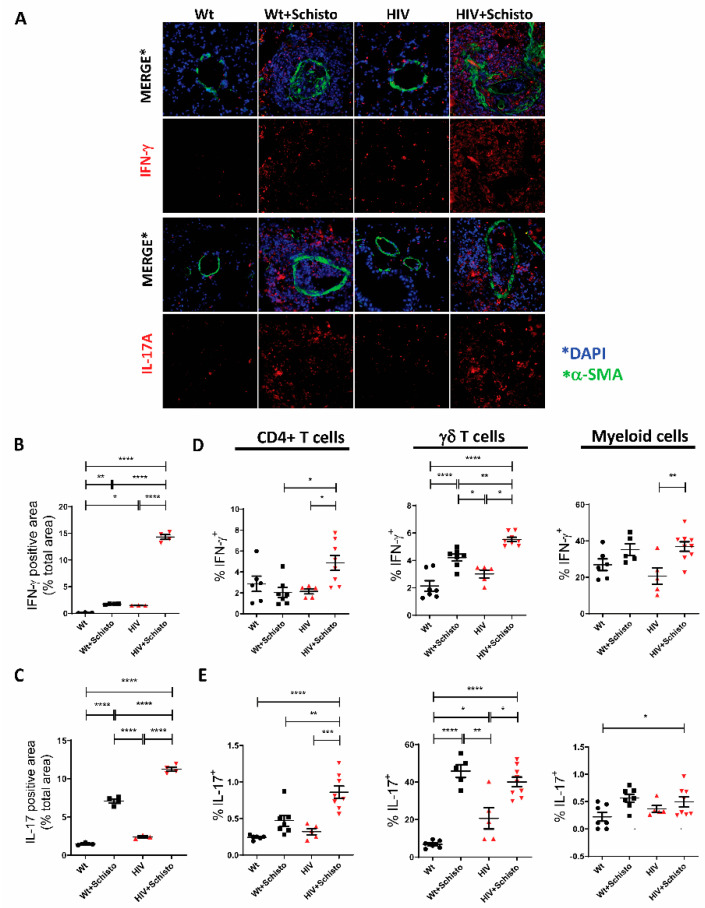
Figure 7.
Pulmonary IFN-γ and IL-17 expression is enhanced in HIV and Schistosoma co-exposed mice (A) Representative immunofluorescence images of lung sections stained with antibodies to α-SMA (green), IFN-γ and IL-17 (A) (red), and DAPI (blue). (B) Quantification of IFN-γ and (C) IL-17A-positive area in the sections shown in panel (A) (n = 3–4 mice per group and 21–31 images per group). * p ≤ 0.05, ** p ≤ 0.01, *** p ≤ 0.001, **** p ≤ 0.0001 (one-way ANOVA). Flow cytometric analysis of intracellular (D) IFN-γ and (E) IL-17A expression in CD4+ T cells (left panel), γδ T cells (middle panel), and myeloid cells (right panel) (n = 5–8). * p ≤ 0.05, ** p ≤ 0.01, *** p ≤ 0.001, and **** p ≤ 0.0001 (one-way ANOVA Tukey).

