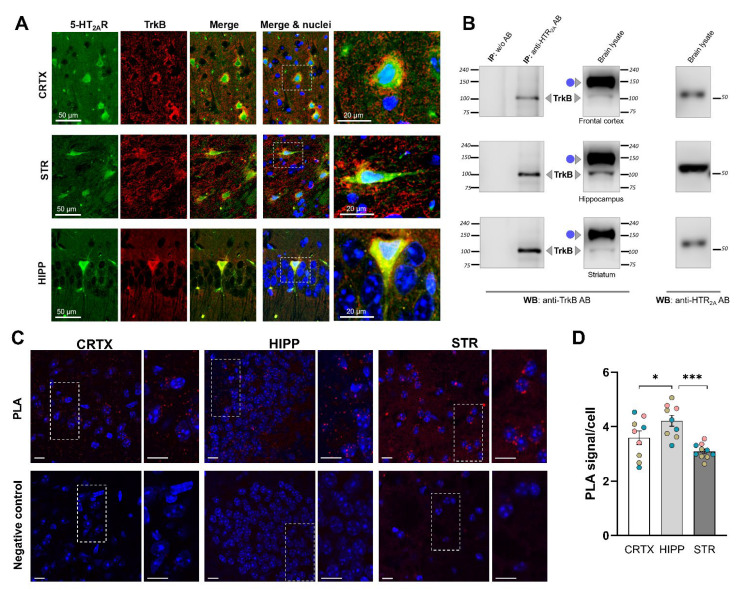
Figure 2.
Interaction between receptors 5-HT2A and TrkB in the mouse brain. (A) Co-localization of 5-HT2A and TrkB in the mouse brain. Brain slices from cortex (CRTX), striatum (STR), and hippocampus (HIPP) were subjected to immunohistochemistry for the detection of 5-HT2A (green) and TrkB (red), followed by confocal microscopy. Nuclei are shown in blue. Right: Merged images and a magnified view of representative neurons. (B) Co-immunoprecipitation between 5-HT2A and TrkB in brain lysates. Whole-brain homogenates were prepared from different brain areas and subjected to IP with an anti-5-HT2A receptor antibody, followed by WB analysis with anti-TrkB and anti-5-HT2A antibodies. AB: antibody; IP, immunoprecipitation; WB, Western blot; ● glycosylated TrkB. Results are representative of at least three independent experiments. (C) Detection of 5-HT2A–TrkB heteroreceptor complexes in mouse brain slices using proximity ligation assay (PLA). Representative images of PLA staining in cortex (CRTX), hippocampus (HIPP), and striatum (STR) are shown as a single Z-stack. Nuclei are shown in blue, and PLA blobs are shown in red. Negative control was performed omitting primary antibodies. Scale bar, 20 µm. (D) Quantification of the 5-HT2A-TrkB heterodimer density. Data are presented as means ± SEM (n = 6 mice). Each colored dot represents data obtained for one mouse. * p < 0.05, *** p < 0.001 (one-way ANOVA).

