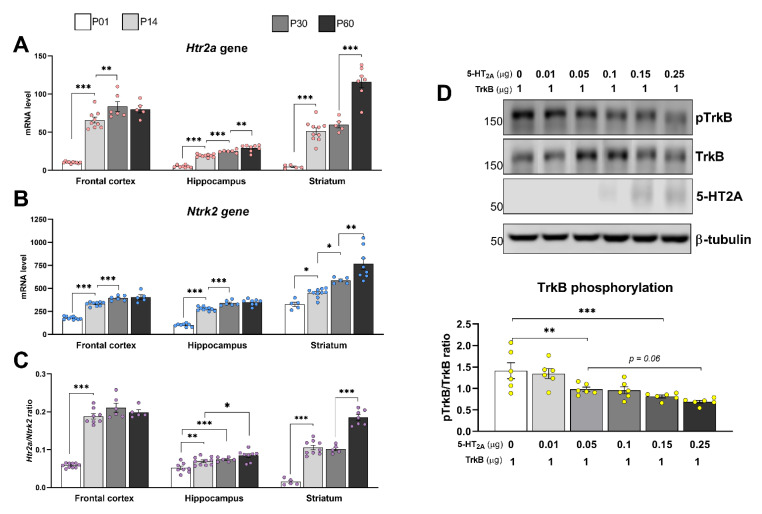
Figure 5.
Expression profiles of TrkB and 5-HT2A receptors during postnatal development. (A,B) Expression levels of mRNAs encoding 5-HT2A (A) and TrkB (B) in the indicated brain regions were determined at different stages of postnatal development using real-time PCR. Gene expression is presented as the number of gene cDNA copies per 100 cDNA copies of Polr2a, used as a calibration control. (C) Expression ratios between 5-HT2A and TrkB. Bars represent means ± SEM (5 ≤ n ≤ 10). * p < 0.05; ** p < 0.01 *** p < 0.001 (one-way ANOVA). (D) Heterodimerization exerts an inhibitory effect on agonist-independent TrkB autophosphorylation. Neuroblastoma cells were co-transfected with 1 μg of cDNA encoding the GFP-tagged TrkB receptor, together with increasing concentrations of HA-tagged 5-HT2A receptor, followed by Western blot (WB) analysis. Lower panel: Quantification of TrkB phosphorylation. Bars show means ± SEM (n = 6). ns: not significant, p = 0.06: an insignificant trend; ** p < 0.01, *** p < 0.001 (one-way ANOVA).

