FIGURE 5.
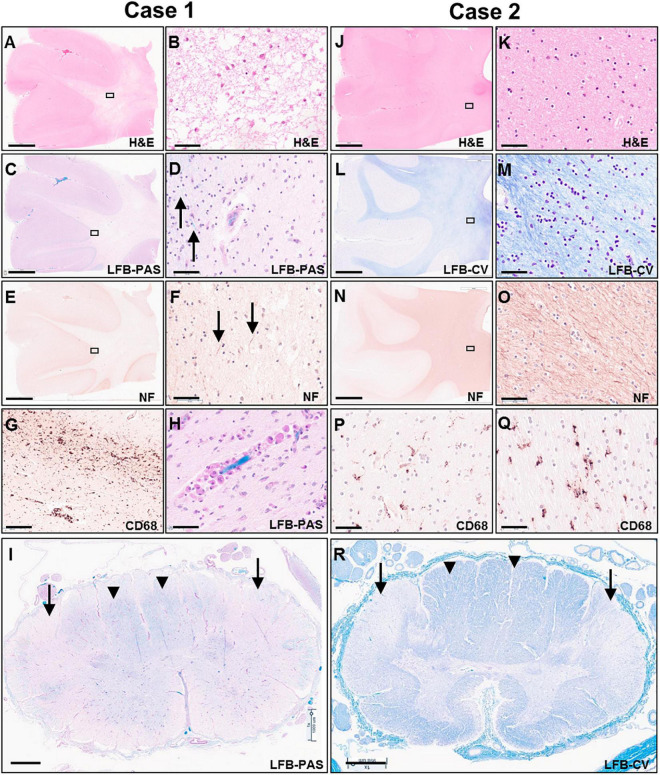
Photomicrographs of representative H&E (A,B,J,K), LFB-PAS (C,D,H,I), LFB-CV (K,L,R), neurofilament (E,F,N,O) and CD68 (G,P,Q) stained sections of the untreated case 1 (left two columns) and transplanted case 2 (right two columns). The rectangular boxes in the low power images indicate the region shown in the adjacent higher-power image. Images (A–H,J–Q) show frontal lobe (middle frontal gyrus) and images (I,R) demonstrate thoracic spinal cord. Arrows in images (D,F) indicate rare residual axons in case 1. Arrows in panels (I,R) point to the lateral corticospinal tracts, whereas arrow heads indicate posterior columns. Scale bars are set to 5 mm in panels (A,C,E,J,L,N); to 1 mm in panels (I,R); and to 50 μm in panels (B,D,F,G,H,K,M,O,P,Q).

