Figure 2.
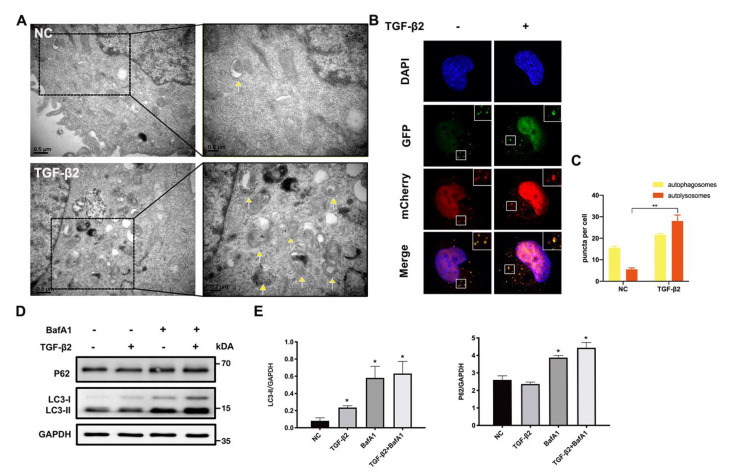
TGF-β2 promotes autophagy flux in HLE cells. (A) Electron micrographs of TGF-β2 (10 ng/mL)-untreated (NC) or -treated HLE cells. The yellow arrows indicate autophagic vacuoles (AVs). Scale bar: 0.5 μm and 0.2 μm. (B) Representative images of GFP-mCherry-LC3 infected HLE cells treated or untreated with TGF-β2 (10 ng/mL) stimulation; the yellow puncta and the red puncta represent autophagosomes and autolysosomes, respectively. The nuclei were stained by DAPI (labeled in blue). Scale bar: 5 μm. (C) Quantification of the autophagosomes and autolysosome puncta per cell. n = 3, >30 cells per experiment, mean ± SD, ** p < 0.01. (D) Immunoblotting of LC3 and p62 in HLE cells treated with TGF-β2 (10 ng/mL) and bafA1 (50 nM) for 24 h. (E) Quantification of the LC3 and p62 protein expression levels, normalized to the GAPDH (n = 3, mean ± SD * p < 0.05).

