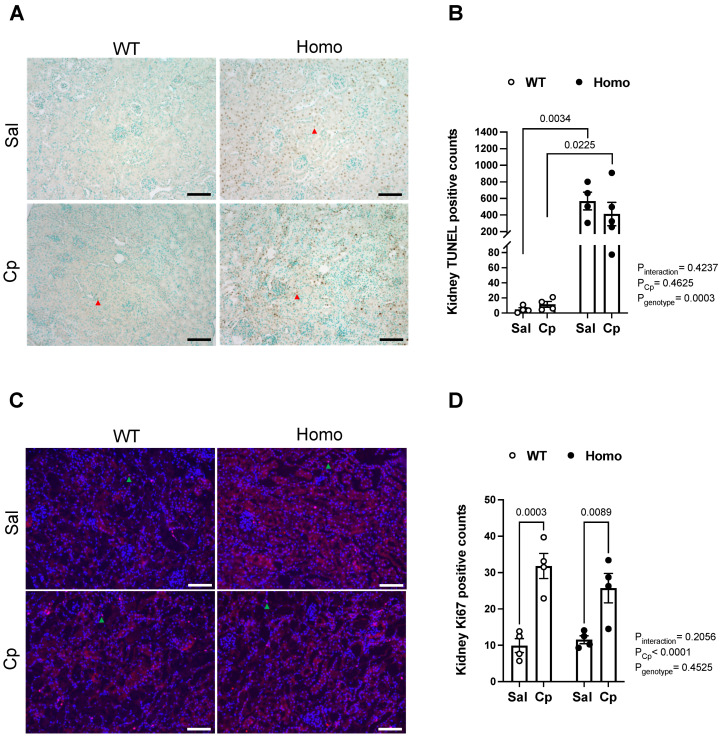
Figure 6.
Effect of GPER1 deletion on cell death and proliferation in cisplatin-treated mice. Representative images for TUNEL assay performed for kidney sections obtained from cisplatin (Cp, 20 mg/kg) or saline-treated male mice, homozygous (homo) knockout for GPER1 gene, and wild-type (WT) littermates on day 3 of the treatment are demonstrated (A). Red arrowheads point to TUNEL-positive nuclei. Quantification of TUNEL-positive nuclei in different experimental groups is demonstrated (B). Representative images for Ki67 immunostaining performed for kidney sections obtained from cisplatin (Cp, 20 mg/kg) or saline-treated homo and WT male mice on day 3 of the treatment are demonstrated (C). Green arrowheads point to TUNEL-positive nuclei. Scale bar represents 200 µm. Quantification of Ki67-positive nuclei in different experimental groups is demonstrated (D). Data are presented as mean ± SEM (n = 4–5 mice/group). Statistical comparisons were performed by two-way ANOVA with Sidak’s post hoc test for multiple comparisons. p values for ANOVA and post hoc test results are displayed on the figure. Cp, cisplatin; Homo, homozygous knockout for GPER1 gene; Sal, saline; TUNEL, Terminal deoxynucleotidyl transferase-mediated dUTP nick-end labeling; WT, wild-type.

