Figure 4.
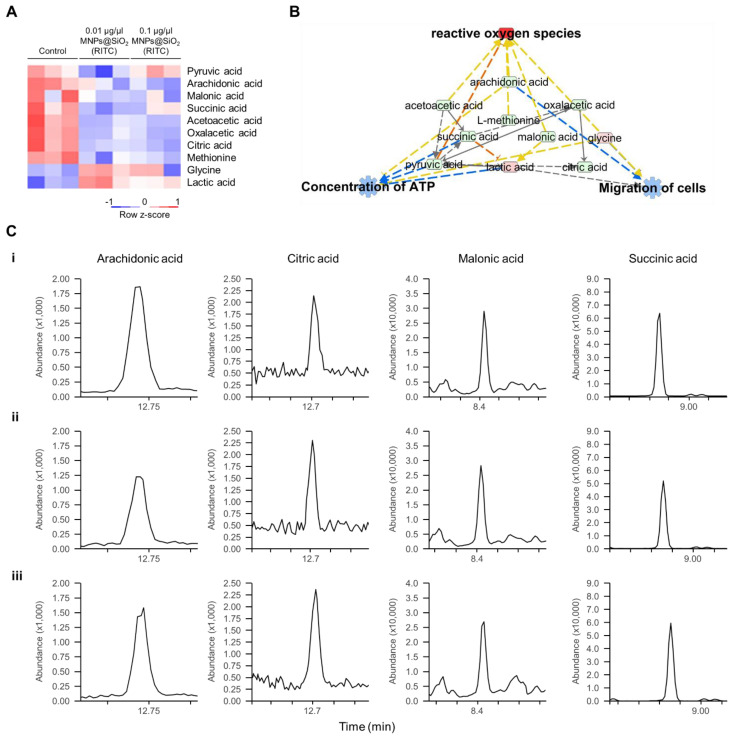
Metabolic profiling of MNPs@SiO2(RITC)-treated BV2 cells. (A) Heatmap of nine metabolites related to the cellular movement in the metabolome of MNPs@SiO2(RITC)-treated BV2 cells as observed with GC–MS/MS analyses. (B) Functional analysis of the metabolomic network in 0.1 μg/μL MNPs@SiO2(RITC)-treated BV2 cells with prediction using IPA. The analysis involved a fold change cut-off value of ±1.2. Red and green nodes indicate genes whose expressions were upregulated and downregulated, respectively, compared to those of the control. Orange and blue arrows indicate the prediction of activation and inhibition, respectively. Details of the shape and colour, which are originated from IPA. (C) Representative selected-ion monitoring chromatograms of arachidonic acid, citric acid, malonic acid, and succinic acid for (i) control, (ii) 0.01, and (iii) 0.1 µg/µL MNPs@SiO2(RITC)-treated BV2 cells.

