Figure 7.
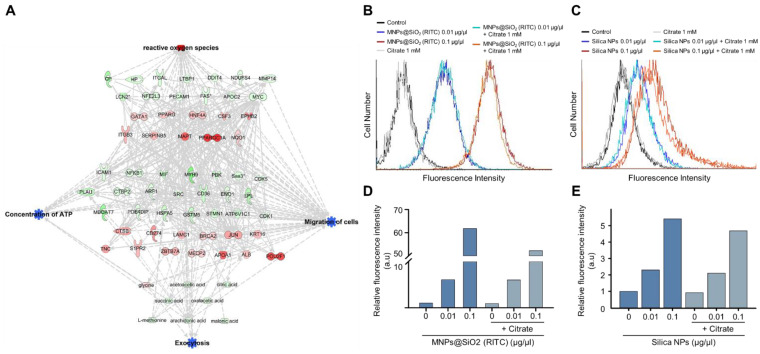
Induction of exocytosis in MNPs@SiO2(RITC)- and silica NP-treated BV2 cells by citrate treatment. (A) Trimmed using machine learning algorithm triple-omics network with the prediction of 0.1 µg/µL MNPs@SiO2(RITC)-treated BV2 cells including exocytosis. Top group: transcriptome, middle group: proteome, bottom group: metabolome. Symbols are described in the legend of Figure S2. Orange and blue areas indicate the prediction as activation and inhibition, respectively. FACS analysis for evaluation of fluorescence of (B) MNPs@SiO2(RITC) and (C) silica NP-treated BV2 cells in the presence of 1 mM citrate. Relative fluorescence intensity of (D) MNPs@SiO2(RITC) and (E) silica NPs in BV2 cells. a.u.: arbitrary unit.

