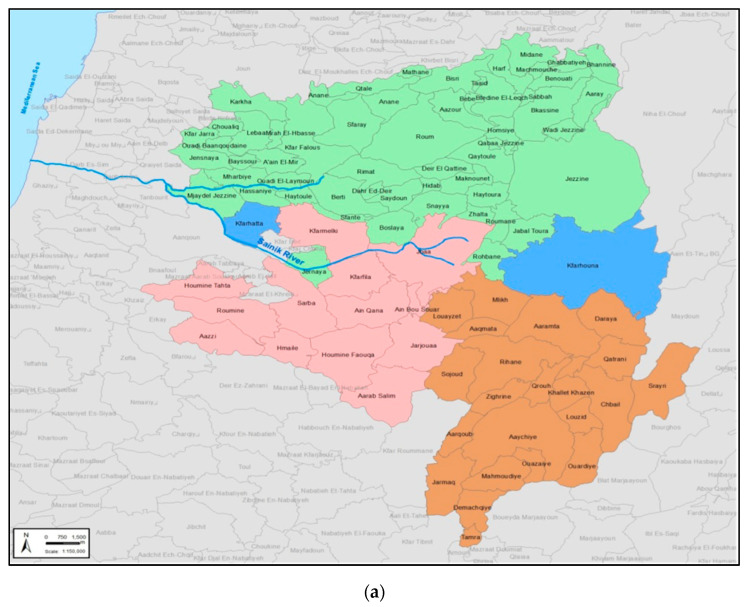
Figure 1.
(a) The RES-Q project area (Region 1 is in red; Region 2 in green; and Region 3 in brown); (b) Kobotoolbox-generated map displaying the first wave of data collected (n = 380); and (c) map displaying the second wave of data collected (n = 389). The blue areas represent the boundaries of each village in the targeted area. The numbers and dots represent the number of questionnaires collected in each village.


