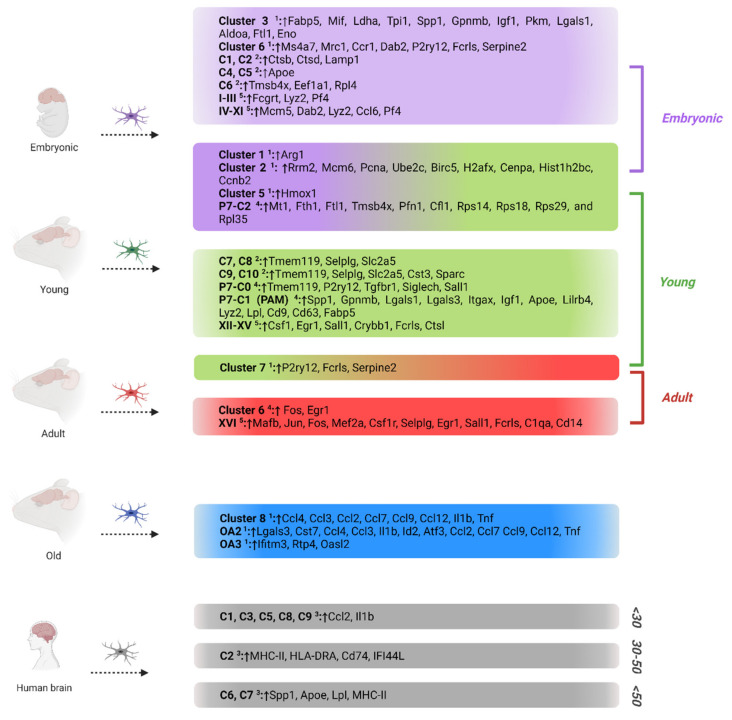
Figure 2.
Overview of the most distinct age-associated microglial populations and their transcriptomic signatures revealed through transcriptional profiling of murine and human microglia using single-cell RNA sequencing. Microglial subsets are represented with superscript numbers as described in the studies of 1 Hammond et al. [15], 2 Masuda et al. [16], 3 Sankowski et al. [18], 4 Li et al. [39], 5 Matcovitch-Natan et al. [40]. ↑ denotes transcriptomic upregulation. Figure created with BioRender.com (accessed on 18 June 2022).

