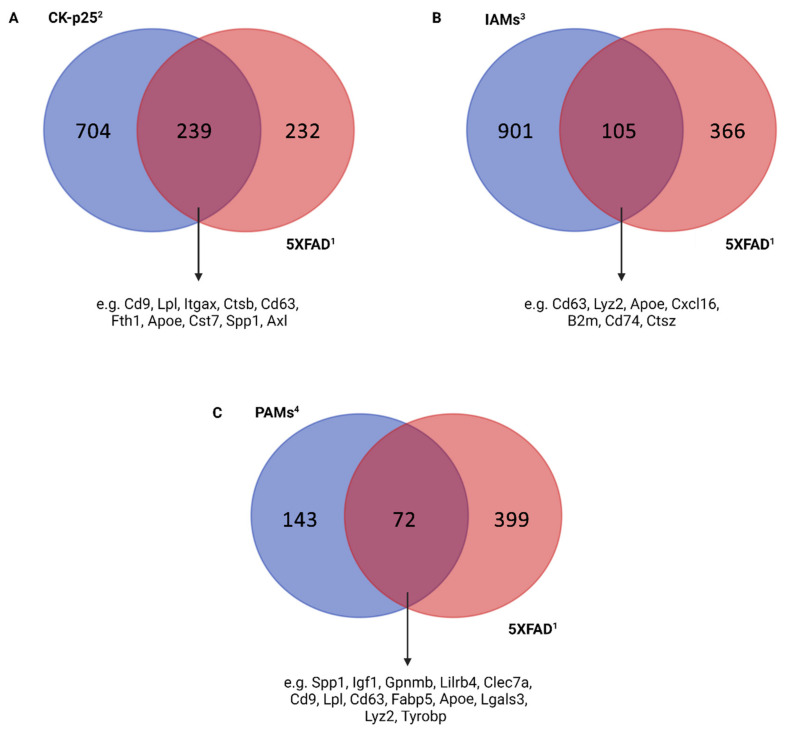
Figure 3.
Comparison of upregulated genes between 1 Keren-Shaul et al. [14] DAM III cluster with different microglial subsets derived through single-cell RNA sequencing uncovers expressional and functional overlaps between them. Only upregulated genes with statistical significance (p-value < 0.05) were used for the comparison. (A) Venn diagrams depicting common and differential transcriptomic patterns between 1 Keren-Shaul et al. [14] DAM III cluster and 2 Mathys et al. [19] late-response cluster 6. (B) Venn diagrams depicting common and differential transcriptomic patterns between 1 Keren-Shaul et al. [14] DAM III cluster and 3 Sousa et al. [20] IAM cluster. (C) Venn diagrams depicting common and differential transcriptomic patterns between 1 Keren-Shaul et al. [14] DAM III cluster and 4 Li et al. [39] PAM clusters. Superscript numbers refer to the respective studies. Figure created with BioRender.com (accessed on 18 June 2022).

