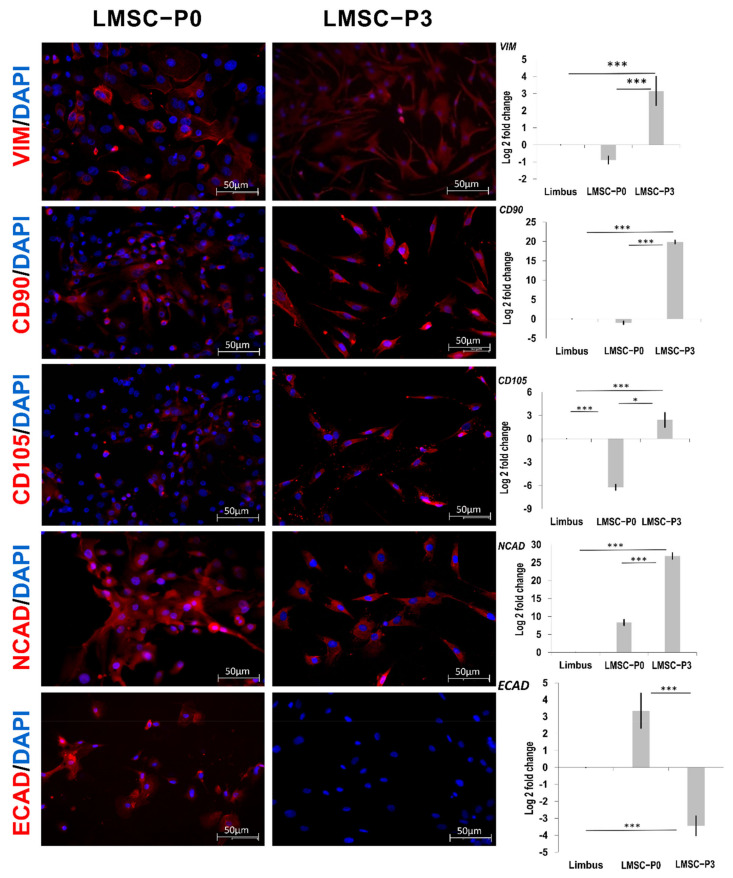
Figure 3.
Limbal stem cells showing mesenchymal stem cell biomarkers. Panel of the representative images of the limbal stem cells showing positive expression of Vim (Vimentin), CD90, and CD105 in both LMSC−P0 (n = 3) and LMSC−P3 (n = 3) populations, counterstained with DAPI (blue). Ncad (N-cadherin) were positive (red) in LMSC−P3 cells and Ecad (E-cadherin) did not show any expression in LMSC−P3. Level of expression of VIM, CD90, CD105, NCAD, ECAD genes quantified using qRT-PCR in LMSC−P0 and LMSC−P3 relative to native limbal tissue (n = 5). Except ECAD remaining genes were found to be up-regulated in LMSC−P3 with fold-change ranging between 2 to 20, which were down-regulated in LMSC−P0. Scale: 50 µm. The results were plotted as mean log 2-fold change ± SD. The statistical analysis was performed using Kruskal–Wallis one-way ANOVA test. * p < 0.05, *** p < 0.001.

