Figure 4.
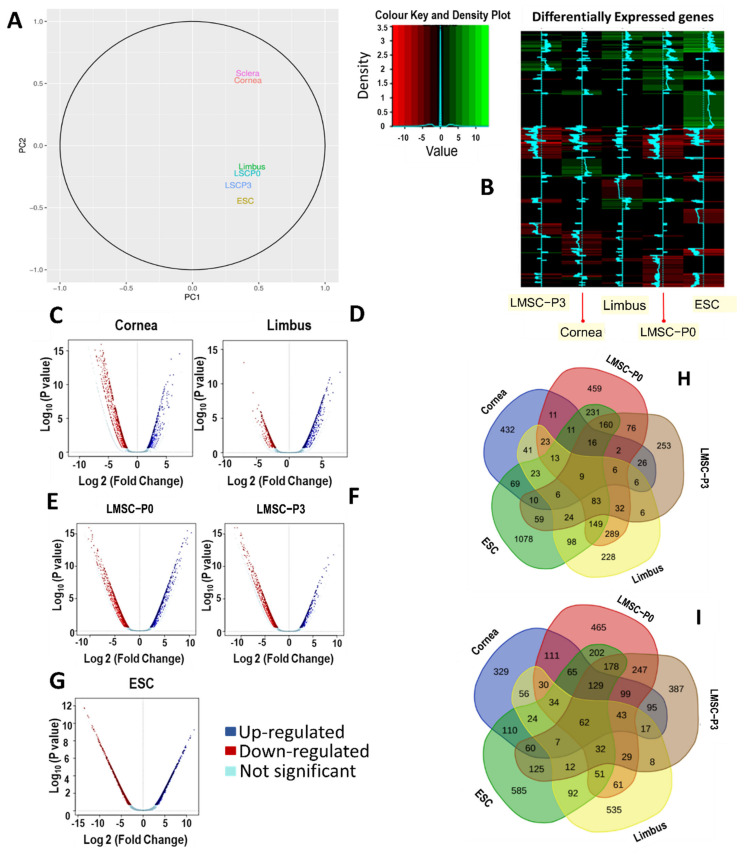
Similarities and asymmetry in the gene expression. (A) The count data from all the samples were transformed using Box-Cox transform to compensate for skewness before PCA analysis. The closer proximity of the samples indicates similarity of the expression profiles of those samples. Sclera and cornea were found to show high similarity in whole transcriptome of expression and were clustered together. Similarly, LMSC−P0 and native limbal tissue were in close proximity, indicating similar transcriptomic signature. LMSC−P3 and ESC were found to be further away from one another, indicating an altered or different expression profile relative to the rest of the analytes. (B) The heat map representing the DEGs in all 5 samples relative to the control (scleral tissue). The rows indicate the genes and columns indicate the samples (cells or tissues). The color intensity represents the level of changes in expression. All significantly up-regulated genes are indicated in green and all significantly down-regulated genes are indicated in red. p < 0.05 was considered to be a statistically significant change in the gene expression. (C–G) Volcano plots of each cell/tissue samples showing the distribution of genes up-regulated (blue) and down-regulated (red). Majority of the genes in corneal tissue were down-regulated while majority of genes in limbus were up-regulated. The primary culture of limbal stromal cells (LMSC−P0) had nearly equal distribution of the genes that were up-regulated and down-regulated. (H,I) Tissue-specific differential expression of the genes: Venn diagrams showing the number of genes that are common and exclusively up-regulated (H) or exclusively down-regulated (I) in cornea, limbus, LMSC−P0, LMSC−P3, and ESC with respect to the scleral tissue (control).

